- RES may add another hydraulic fracturing fleet (net) in 2023.
- Although its FY2023 capex can increase, it expects to generate positive free cash flow in 2023.
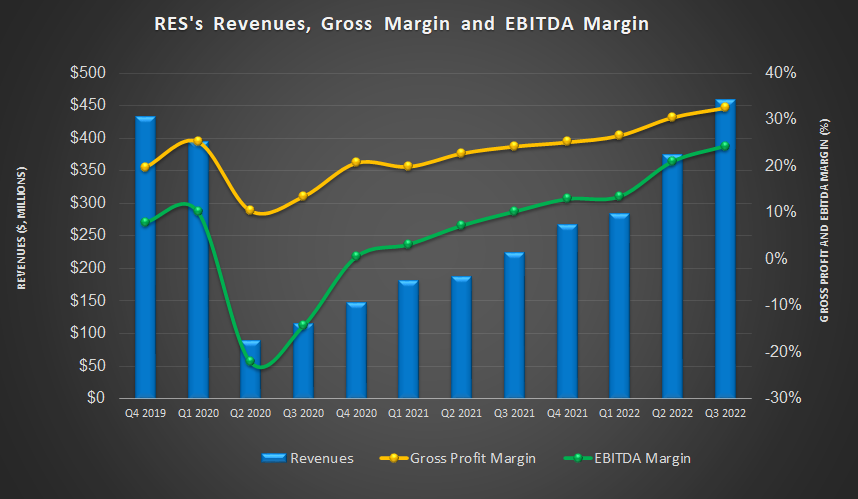
- Gross and EBITDA margin recovery is encouraging for the FCF recovery.
- Continuing with the cash dividend started in July, it will look to increase shareholders’ returns.
Changes In The Fleet Strategy
In the Q3 call, the management expressed sufficient confidence in the number of fleets it has deployed. It is currently working on refurbishing an old system. In 2023, it may add a new horizontal frac fleet, withdraw another more aging fleet, and retire it, so that the net addition remains at one fleet. Until Q3, it deployed nine frac fleets.
Investors may note that RES generates most of its revenues from pressure pumping (56% in Q3), followed by downhole tools ThruTubing Solutions (22.4%) and coiled tubing (8.1%). As far as pricing goes, the company also sees a positive momentum that can carry in Q4. The fracking activity, however, may slightly slip in Q4. Nonetheless, the industry’s overall mood is upbeat and will likely follow in 2023. Read our previous article to know more about RPC.
Analyzing Industry Indicators
In the past year, until October 2022, the completed wells count growth (5% up) underperformed the drilled well count (48% up). But, the drilled but uncompleted wells declined (17% down). Appalachia (14.3% up) and Eagle Ford (12.5% up) topped among the shales that saw higher crude oil production in the past year. Crude oil production in Niobrara decreased (1% down) in this timeframe.
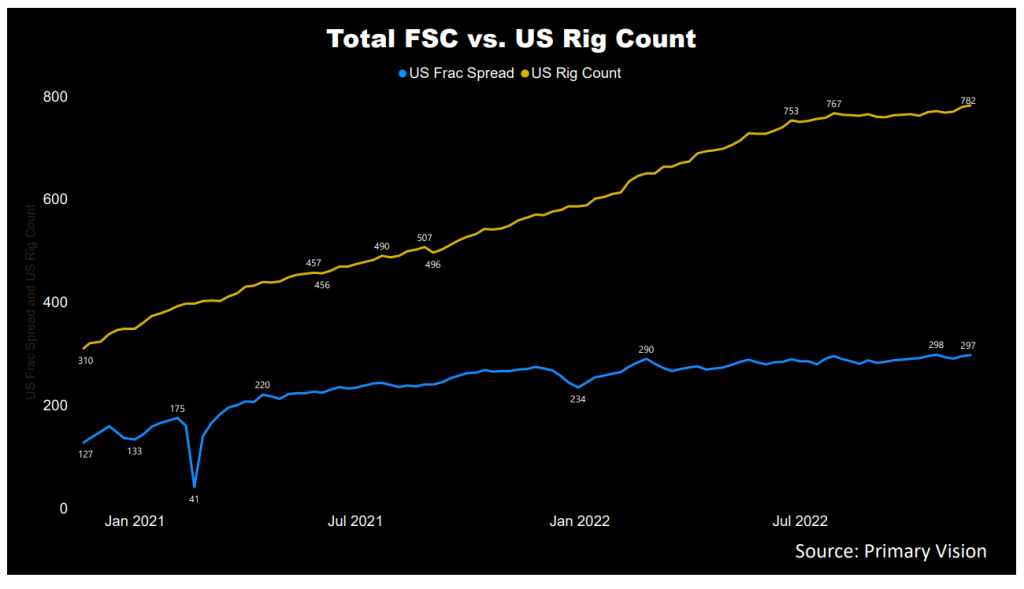
The crude oil price’s upward run led to the average crude oil production in these shales going up 7.5% in the past year until October 2022. Since the start of 2022, the US rig count pressed ahead (34% up) of the US frac spread count (27% up), as estimated by Primary Vision. So, the short-term indicators are encouraging.
What Were The Q3 Drivers?

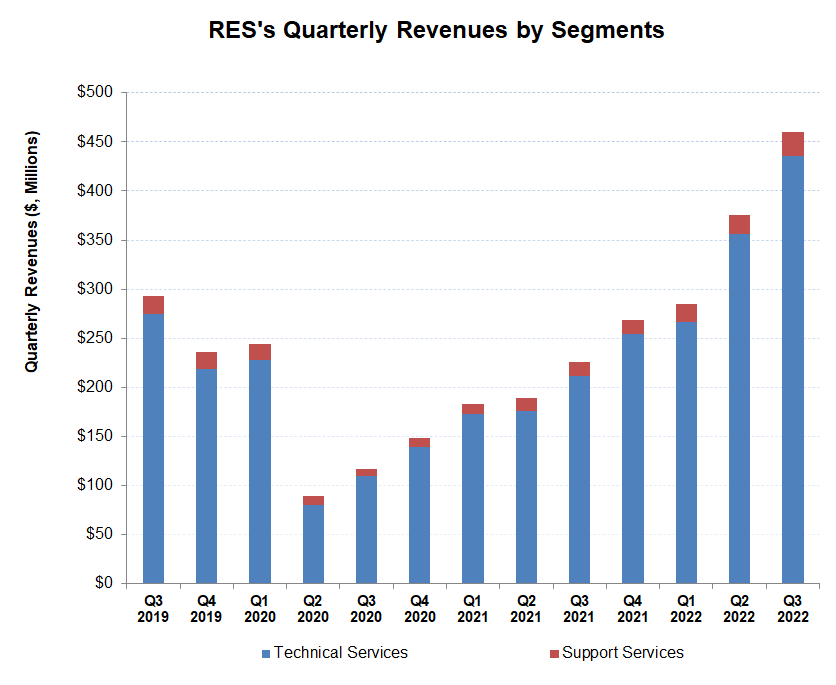
In Q3 2022, Technical Services revenues increased by 22% compared to Q2 2022. Higher customer activity levels, pricing hikes, and a more extensive frac fleet led to sequential revenue growth. The segment’s operating income also improves significantly (50% up) in Q3.
Operating profit increased by 52.6% in Q3 as the positive effects of higher revenues, price hikes, and SG&A cost control took effect. The Support Services segment saw a similar revenue growth (23% up) in Q3, while the operating income increased by 58% driven by improved profitability in the rental tools service line. Overall, the company’s cost of revenues (as a percentage of revenues) decreased by 210 basis points due to a moderation in direct employment costs’ share in the portfolio. Higher pricing and revenue also impacted the margin positively.
Capex Growth, Cash Flows, And Liquidity
Led by much higher revenues in 9M 2022 than a year ago, cash flow from operations increased (55% up). However, significantly higher accounts receivable following the increase in customer activity level partially offset the cash flow’s growth. As of September 30, 2022, the company had no debt and positive cash & cash equivalents balance ($37 million).
Capex doubled in 9M in 2022 compared to a year ago. As a result, free cash flow steeped more into the negative territory. In FY2023, the management expects capex to increase marginally. Still, it expects to become free cash flow accretive in FY2023. Although it will continue to maintain its equipment and capacity, a positive FCF will increase the shareholders’ returns. The company pays an annual dividend of $0.02 per share, which translates into a 0.18% dividend yield. To guard against any liquidity strain, the company can tap from its $120 million available liquidity (revolving credit facility plus cash & equivalents).
Learn about RES’s revenue and EBITDA estimates, relative valuation, and target price in Part 2 of the article.