
- Calfrac is considering reactivating another pressure-pumping fleet in 2023.
- The company’s average adjusted EBITDA per fleet more than tripled in the past year.
- A new contract for Argentina’s dedicated fracturing fleet and coiled tubing unit came into effect in Q3.
- The company’s leverage is relatively high, but improved cash flows lower the risk factors.
Margin Expansion And Outlook
As we discussed in our previous article, Calfrac’s (CFWFF) outlook is tied to the pressure pumping industry, which still remains undersupplied, leading to a pricing recovery for the services. Despite the medium-term bullish factors, the demand side is discounting the seasonal factors, the economic recession, and a COVID resurgence. Nonetheless, the positive momentum can carry in 2023.
Calfrac’s profitability has mainly been a beneficiary of the positive developments in the industry, reflecting an average adjusted EBITDA per fleet that more than tripled in the past year. So, it is optimizing the fracturing schedule for its operating crews and plans to reactivate the 10th fleet, which has recently commenced operations. Even without taking into effect any possible price increase, it can reach $20 million – $25 million EBITDA per fleet moving forward, given the demand-pull coming from the Rockies region, the Bakken, and into Colorado.
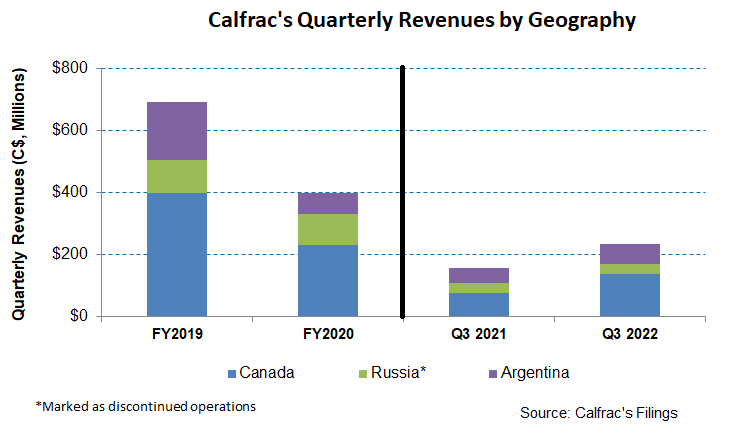
In Canada, following a steady utilization of the company’s four large fleets and five coiled tubing units in Q3, it evaluates equipment expansion options to activate additional fleets. In Argentina, Calfrac’s financial performance improved as a new contract for the dedicated fracturing fleet and coiled tubing unit in the Vaca Muerta shale play came into effect. Utilization in this region should remain high for the rest of the year, while the margin should improve and move closer to its North American margin level in the medium term.
Rigs And Frac Spread Count
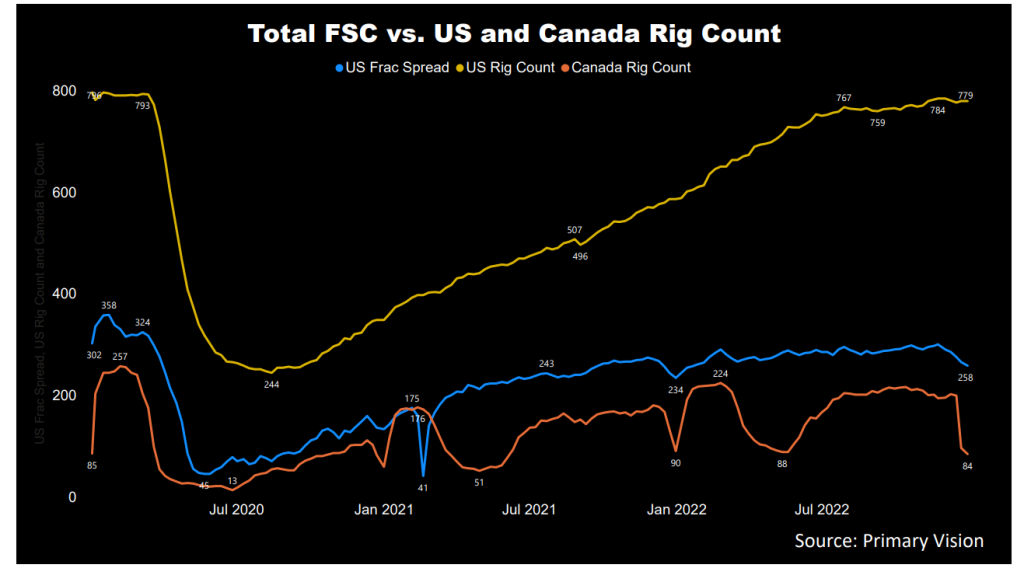
The US active frac spread count year-to-date went up by 13%, according to Primary Vision’s estimates. In this period, the drilled and completed well count was higher (35% and 19% up, respectively), while the drilled but uncompleted (or DUC) wells declined by 11%. Many shales saw higher frac spread count addition during this period. As of now, the US rig count has increased marginally in Q4. The rig count in Canada weakened sharply in December 2022, falling by 58% in the past weeks alone as the winter set in.
Canada: Performance And Outlook
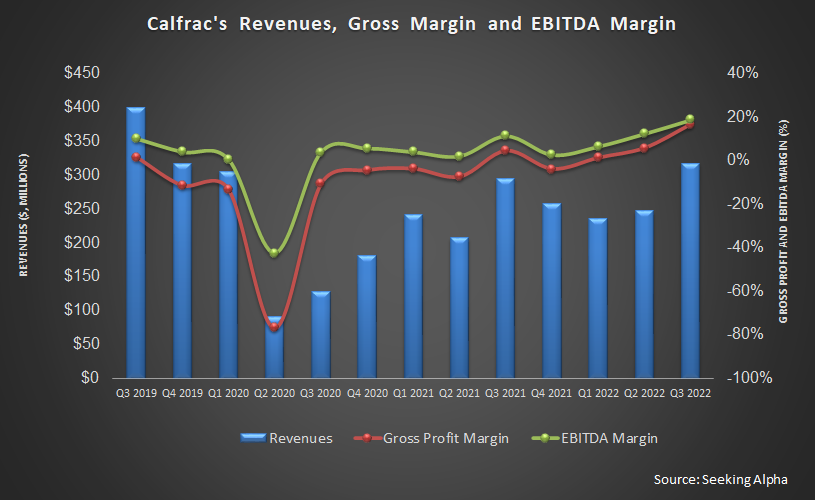
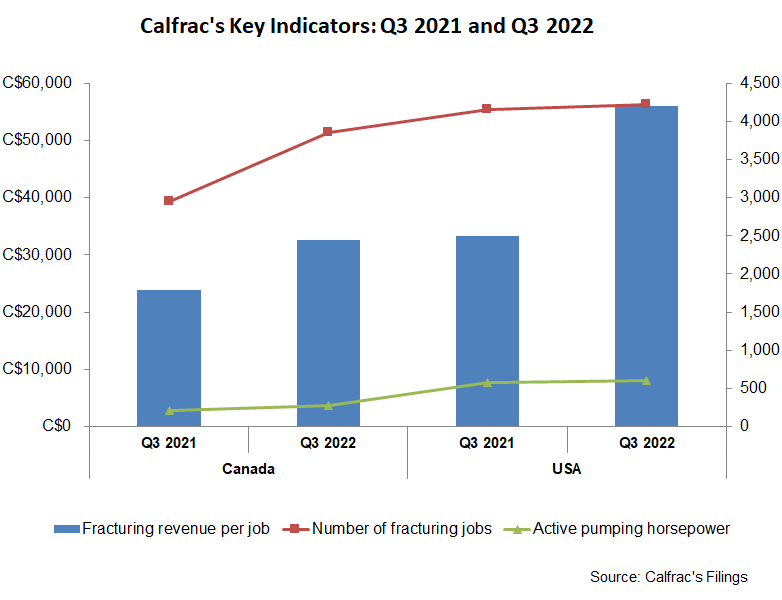
Year-over-year, Calfrac’s revenues from Canada increased by 79% in Q3 2022 due primarily to the steady utilization of four large fleets and five coiled tubing units. Fracturing jobs and revenue per job increased by 31% and 37% in the past year. Pricing, too, improved during this period. As a result, the adjusted EBITDA margin expanded by 730 basis points to 26.8%.
Analyzing Recent Performance in US and Argentina
Calfrac’s revenues from the US increased by 71% in Q3 2022 compared to a year ago. The adjusted EBITDA margin expanded to 23.1% in Q3 2022 compared to 10% a year ago. The average adjusted EBITDA per fleet more than tripled during this period due primarily to 68% higher fracturing revenue per job. However, the number of fracturing jobs and pumping horsepower remained relatively unchanged in the past year.
Its revenues from Argentina made significant progress (34% up) in Q3. Investors may note that a new contract for the fracturing fleet and coiled tubing unit in the Vaca Muerta shale play took effect during the quarter. The adjusted EBITDA margin, however, did not change in the past year in this region.
Cash Flows and Balance Sheet
Calfrac’s cash flow from operations (or CFO) improved and turned positive in 9M 2022 compared to a negative CFO a year ago. The turnaround was led primarily by higher revenues in the past year, although a much higher working capital requirement dented CFO’s progress. Although free cash flow improved in 9M 2022 versus a year ago, it remained marginally in the negative territory.
Calfrac’s debt-to-equity ratio (1.15x) is lower than Nabors Industries (NBR) but higher than some of its peers, like Trican Well Services (TOLWF). By Q3-end, it converted a part of its lien notes into common shares, which helped improve the leverage ratio. The conversion price was $1.3325 per share versus CFWFF’s current stock price of $4.55. As of September 30, 2022, its liquidity (cash plus investments plus availability of borrowings under the revolving credit facility) was $61 million.
Learn about Calfrac’s revenue and EBITDA estimates, relative valuation, and target price in Part 2 of the article.


