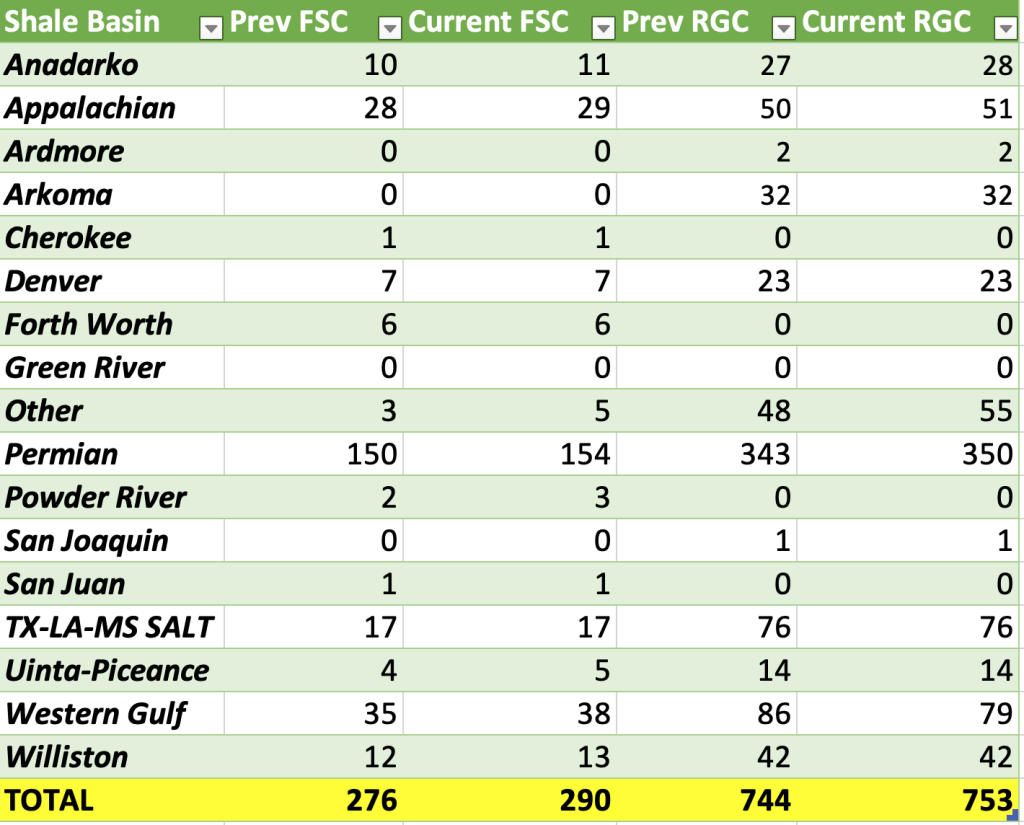
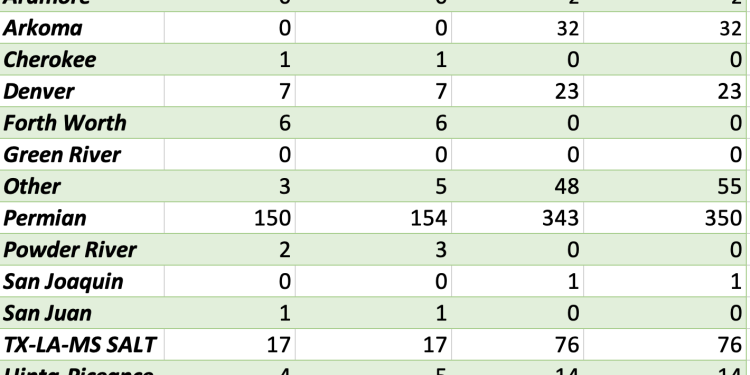
We finally had the spring bump in completion activity with a nice move to 290. There is typically a spike as we approach the end of March or the 1st week of April. We have been consistent in expecting an increase to about 285-287, and here we have the bounce to 290. Over the next few weeks, activity will bounce around between 285-293 as E&Ps prepare for the Spring push and gear up for summer. We shared the ratio chart last week highlighting how spreads still had some room to make up, and this increase helps close the gap against the horizontal rigs in the field. So far, activity is following the patterns we laid out in the end of ’22 and so far throughout ’23.

The market continues to fluctuate following the failure of Silicon Valley Bank and Silvergate. As we called out last month, we were concerned about small banks as bad debt expense was rising and duration risk was hitting many of the assets. Small banks will remain under pressure as credit card and auto loan delinquencies rise across the board. Many banks are facing a rising rate of “non-performing loans”, which means they have to increase their bad debt expense limiting the amount of new bonds/loans they can create. This locks them in to fixed income products at lower yields, and if they didn’t manage their hedge book appropriately- invested only in longer duration treasuries at yields closer to 1%. This creates a stress point- especially if companies start to pull their deposits.

The Fed quickly dumped a ton of liquidity back into the market with $297B getting pushed back into the market. This “undid” nearly half of the QT that has happened since last April- and it happened in a single week. We have been highlighting for YEARS that this was going to be an extremely painful and bumpy unwind of the largest monetary mistake in history.

Central banks around the world have carried out ZIRP (Zero Interest Rate Policy) and QE (Quantitative Easing) that flooded the market with cheap liquidity. As the access to cheap money persisted, we saw a constant degradation in risk management, due diligence, focus on cash flow, and other key metrics to highlight the strength of an investment. It gave rise to behemoth companies that were just zombies or said differently- Companies that earn enough money to pay off interest expense and service the debt but unable to actual repay the debt. There is no excess capital for growth, and they are typically free cash flow negative and have to rely on the debt markets to pay their bills. When you can borrow capital at low rates a company can bounce along, but the moment rates go higher the corporation gets squeezed. We need to see a “purge” of the system to reallocate capital to companies/organizations that have a clear path to growth and expansion. But, many banks (especially small banks) are holding the debt that companies are struggling to roll into a new bond.
The below charts put into perspective just how much exposure small banks have to real estate (residential and commercial) and consumer loans. We have already seen Brookfield and Blackstone default on sizeable commercial loans, and the stress is only going to increase as properties can’t roll their maturing debt.


Weekly net new lending by small (lhs) and large (rhs) banks, where you count as “large” if you’re one of the 25 top US banks. Small banks have basically been lending heavily into commercial (blue) and residential (orange) real estate. That’s now likely to see a “sudden stop” as banks lock down and increase their bad debt expense balances.

There have now been eleven banks depositing $30B to backstop First Republic Bank and provide liquidity to keep them solvent.

“Then later on Thursday, the Fed published data showing how heavily banks are drawing on its assistance. They borrowed a combined $164.8 billion from two backstop facilities in the most recent week ended March 15. That includes a record $152.85 billion from the discount window, the traditional liquidity backstop for banks. The prior all-time high was $111 billion reached during the 2008 financial crisis.” I was working in Money Markets during the 2007-2008 surge, and we saw a lot of cracks forming in the system. Now the stress has SURGED above the levels we saw in ’08, and this recent spike is happening when we still have a RECORD amount of liquidity in the market.

The stress in the financial markets isn’t going to abate anytime soon and will cause pressure across the board. We are starting to see even more pressure emerge in the CAPEX universe as well, and this isn’t something that will pivot anytime soon as the global economy slows.

As the cycle comes to a close, we are going to see way more stress across the banking sector. This will push banks to lend less money, and the deals they do underwrite are going to be at higher interest rates. Even with the different bail-outs/bail-ins, the banks willingness is only going to deteriorate further.

The stress is continuing to gross as the U.S. leading indicators fell .3% in Feb, which is the 11th consecutive decline with the index now down 6.5% year over year. It’s important to highlight that this decline is BEFORE the recent banking crisis that unfolded in this month.

Another important metrics is the University of Michigan Consumer Sentiment index, which dropped again in March. Even though the data is collected in March, most of it is collected in the first week of the month and a large part of it was assembled PRIOR to the banking issues. We expect to see another sizeable stepdown as the consumer absorbs the recent financial sector shakeup.

Confidence falling amid elevated prices (esp low income) & financial market volatility:
- 63.4 (-3.6pt): 4-mo low
- Current Conditions 66.4 (-4.3pt)- 4 month low
- Expectations 61.5 (-3.2pts)- 4 month low
These shifts are only going to push crude demand lower as economic stress ratchets higher. We already discussed last week how the physical market was slowing and price cuts were being rolled out across the board. Angola is cutting exports in May following weakness in their April sale program with renewed drops in pricing.
Angola to cut its crude exports to 1.01m b/d in May, according to a preliminary program. Vitol cut offers of Agbami and Dalia but still failed to find buyers.
PLATTS:
- Vitol offered 500k bbl of Agbami for April 10-20 delivery at Dated +$3/bbl, CIF Rotterdam: trader monitoring Platts window
- Compares with +$3.50 for its previous offer on Wednesday
- Also offered 340k bbl of Dalia for March 17-22 delivery at Dated -$4/bbl
- Compares with its previous offer at -$3.05 on March 9
ANGOLAN PROGRAMS:
- Angola plans to cut crude exports to 31.3m bbl, or 1.01m b/d, in May, according to a preliminary schedule seen by Bloomberg
- Compares with revised 1.09m b/d for April
- May program comprises 33 cargoes
So far, flows from Russia appear to be normal with OPEC+ holding steady on their production levels for now. We have seen a sizeable amount of Russian volume flow into the Chinese market, and we see that remaining fairly steady over the next few weeks.
“Tankers that are involved in transporting Russian oil account for 18% of the world’s wet cargo fleet, according to a report from maritime artificial intelligence firm Windward Ltd. and Vortexa.
- Over 900 vessels have been identified as being part of the “gray fleet” — a new phenomenon evolving from the Russian war — and ~1,100 ships as part of the “dark fleet”
- NOTE: Report defines the fleet as gray when it’s difficult to determine legality and sanctions compliance, and dark when they’ve been observed using deceptive shipping practices to obscure flows
- The “gray fleet” carried ~2.6m b/d each month post invasion, which translates to a 68% increase when compared with pre-war levels
- Turkey has emerged as the predominant buyer of Russian products
- A higher number of buyers have also appeared for Russian diesel in North and West Africa, the Middle East and Brazil”
In the recent OPEC report, they expect builds of about 300k barrels per day in 2Q, which we expect to accelerate as demand diminishes with more economic pressures emerging.
We expect Russian diesel exports to remain elevated as we see more product going into storage. The below chart puts into perspective how much diesel has been pushed into the market. It will keep prices capped, and we expect more builds across Singapore and Fujairah.

There are also some cracks emerging in India regarding their product sales, which is something we have been expecting to see. India’s refined product sales were strong in Feb, but we expected to see more of a slowdown as the economy cooled and inflation hit a bit harder internally. This will keep storage elevated in Singapore and put more pressure on local refiners.
Sales of diesel by India’s state-owned refiners dropped 4.6% m/m to 3.2 million tons over the first 15 days of March, according to data from refinery officials familiar with the matter.
- Diesel sales were also down 10.2% y/y
- Gasoline sales -0.5% m/m to 1.2m tons, -1.4% y/y
- Jet fuel sales -0.1% m/m to ~295k tons, +19.2% y/y
- LPG sales -15.1% m/m to 1.2m tons, -9.7% y/y
- NOTE: Indian Oil Corp., Bharat Petroleum Corp. and Hindustan Petroleum Corp. own 90% of retail fuel outlets in India
“Russia’s flows remain strong with India also coming in as a strong buyer as well. “Russia’s seaborne crude flows rebounded last week, with India now making inroads into the country’s Pacific exports having taken the bulk of cargoes shipped from western ports after a European embargo. In the seven days to March 10, Russia’s shipments recovered 40% of the previous weeks’ loss, rising to 3.33 million barrels a day. The less-volatile four-week average also rose. There has been no obvious decline in Russia’s seaborne exports since its troops invaded Ukraine more than a year ago, though there may have been an overall drop in flows because tankers have taken on some crude previously sent to Europe through the Druzhba pipeline. As yet, there’s no sign of flows being impacted by the 500,000-barrels-a-day output cut that Russia said it would impose in March.”
As we have stated, Russian exports will remain stable even as production falls given the shift in oil flows away from internal refining and pushed into the export market.


Asia Pacific (ex-China) and North America have seen a bit of a slowdown in driving activity while Europe had a nice increase above “normal.”

Chinese activity has held up fairly well over the last few weeks as it still trends a bit lower.

Some of the key areas to watch will remain Singapore. They had sizeable builds across the board with a sizeable increase in all levels- pushing light disty back to a record.

So far, we have seen middle disty cracks hold firm, but the pressure is mounting and we think there is going to be a bigger move to the downside forcing run cuts. We have been very consistent with our concerns across the broader economy. It has taken time for things to play out, but the economic data and macro drivers have been very consistent. We see more downside pressure across the board as the financial stress continues to spread around the global financial system.


