Primary Vision
  • HOME
  • ABOUT US
    • ABOUT US
    • PRIMARY VISION AI INNOVATIONS
  • EFRACS
  • EVENTS
  • PRESS
  • SUPPORT
  • FAQ
  • LATEST NEWS
  • LOGIN
  • HOME
  • ABOUT US
    • ABOUT US
    • PRIMARY VISION AI INNOVATIONS
  • EFRACS
  • EVENTS
  • PRESS
  • SUPPORT
  • FAQ
  • LATEST NEWS
  • LOGIN
No Result
View All Result
Primary Vision
Home FREE ARTICLE

Year-Over-Year Oil Data (USA)

Matthew Johnson by Matthew Johnson
April 10, 2023
in FREE ARTICLE
0
Year-Over-Year Oil Data (USA)

I have captured key industry data, as it relates to the previous business week, via this post’s infographic. The below information further complements said #infographic.

(Oil Rig Count: Baker Hughes report)

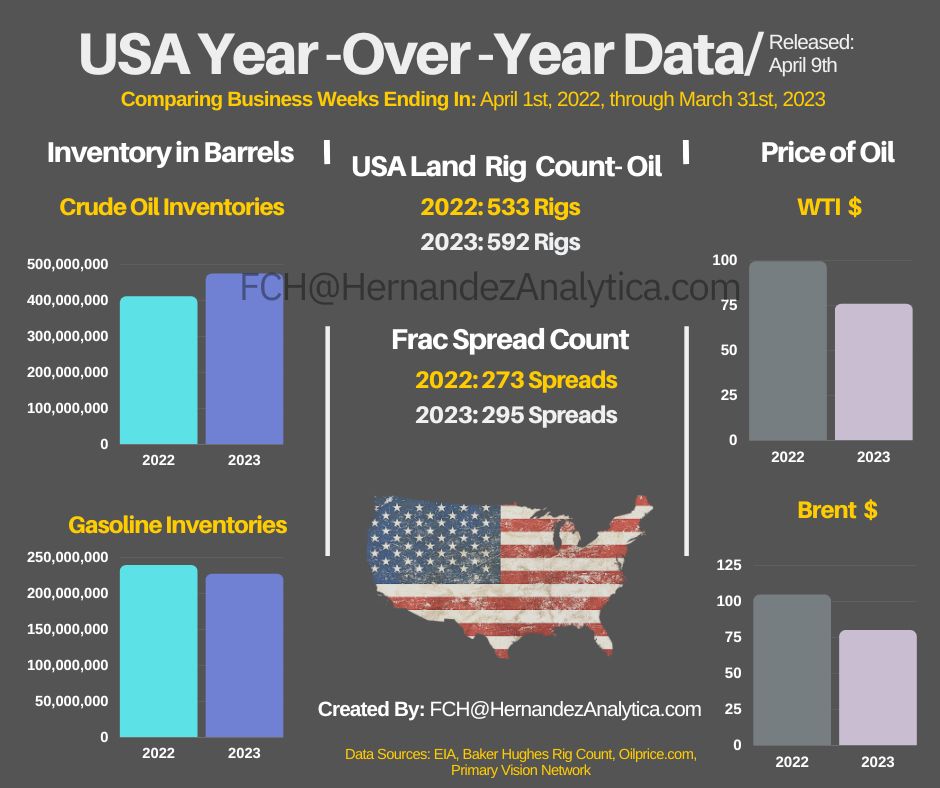
  • April 1st, 2022: 533
  • March 31st, 2023: 592

(Primary Vision Network – Frac Spread Count)

  • April 1st, 2022: 273
  • March 31st, 2023: 295

(Oilprice site: #WTI price:)

  • April 1st, 2022: 104.39 USD
  • March 31st, 2023: 79.77 USD

(OilPrice site: Brent Crude price)

  • April 1st, 2022: 99.27 USD
  • March 31st, 2023: 75.67 USD

(EIA Crude Oil Inventories – Agency reports on varying days)

  • March 25th, 2022: 409,950,000
  • March 24th, 2023: 473,691,000

(EIA Gasoline Inventories – Agency reports on varying days)

  • March 25th, 2022: 238,828,000
  • March 24th, 2023: 226,694,000
Previous Post

Demise of the Dollar, OPEC vs Fed+

Next Post

IMF Paints a Gloomy Picture

Related Posts

What is common between U.S. economy and global oil markets?
FREE ARTICLE

What is common between U.S. economy and global oil markets?

September 9, 2025
Free Read: Why is it important to follow Japanese bond yields
FREE ARTICLE

Free Read: Why is it important to follow Japanese bond yields

July 21, 2025
Free Read: Decoding the Latest Job Report
FREE ARTICLE

Free Read: Decoding the Latest Job Report

July 10, 2025
Free Read: China will not be impacted by the closure of Straits of Hormuz
FREE ARTICLE

Free Read: China will not be impacted by the closure of Straits of Hormuz

June 23, 2025
How does the current Middle East Situation play out?
FREE ARTICLE

How does the current Middle East Situation play out?

June 19, 2025
FREE READ: Oil Markets Trying to find direction
FREE ARTICLE

FREE READ: Oil Markets Trying to find direction

May 14, 2025
Next Post
IMF Paints a Gloomy Picture

IMF Paints a Gloomy Picture

Please login to join discussion

Recent News

What is common between U.S. economy and global oil markets?

What is common between U.S. economy and global oil markets?

September 9, 2025
STEP Energy Services: Q2 TAKE THREE

STEP Energy Services: Q2 TAKE THREE

August 8, 2025
ProFrac Holding: Q2 TAKE THREE

ProFrac Holding: Q2 TAKE THREE

August 7, 2025
KLX Energy Services: Q2 TAKE THREE

KLX Energy Services: Q2 TAKE THREE

August 7, 2025
Nine Energy Service: Q2 TAKE THREE

Nine Energy Service: Q2 TAKE THREE

August 6, 2025
Primary Vision

Established in 2011, we are renowned for our expert frac data and analytics, providing a rich array of unique indicators and industry commentary.

CONTACT

+1-713-554-4977
info@primaryvision.co

SOCIAL NETWORKS

POLICIES

Privacy Policy
Terms of Use

PARTNERS

Amazon Web Services

TRUSTED SITES

Logo

Logo

RECENT NEWS

What is common between U.S. economy and global oil markets?

What is common between U.S. economy and global oil markets?

September 9, 2025
STEP Energy Services: Q2 TAKE THREE

STEP Energy Services: Q2 TAKE THREE

August 8, 2025
ProFrac Holding: Q2 TAKE THREE

ProFrac Holding: Q2 TAKE THREE

August 7, 2025
KLX Energy Services: Q2 TAKE THREE

KLX Energy Services: Q2 TAKE THREE

August 7, 2025
Nine Energy Service: Q2 TAKE THREE

Nine Energy Service: Q2 TAKE THREE

August 6, 2025
  • HOME
  • ABOUT US
  • EFRACS
  • EVENTS
  • PRESS
  • SUPPORT
  • FAQ
  • LATEST NEWS
  • LOGIN

© 2025 Primary Vision. All rights reserved.

  • HOME
  • ABOUT US
    • ABOUT US
    • PRIMARY VISION AI INNOVATIONS
  • EFRACS
  • EVENTS
  • PRESS
  • SUPPORT
  • FAQ
  • LATEST NEWS
  • LOGIN

© 2025 Primary Vision. All rights reserved.

Notifications