Outlook and HAL’s Strategies
We have already discussed Halliburton’s (HAL) Q1 2023 financial performance in our recent article. Here is an outline of its strategies and outlook. Reiterating the previous quarter’s comments, Halliburton expects North American upstream capex to grow by 10% in 2023. Capex growth in international geographies can outpace North America, moving up by “high teens” in 2023.
In Q2, Halliburton’s management placed focus on collaboration. Effective collaboration can differentiate its services and become a source of its competitive advantage. HAL and Vår Energi recently announced a long-term strategic relationship for drilling services. Its initiatives should bring cost-effective technologies and better performance in the US and other regions.
Electric Fracking
One notable introduction to HAL’s repertoire has been the introduction of the Zeus electric fracturing system, which offers grid power solutions. In Q2, it signed many multi-year contracts for Zeus, which should provide stability and secure economic return. With the Octave automating equipment, Zeus now offers a fully integrated system. In 2023, the company’s e-fleets pumped over 10% more hours than the high-performance diesel fleets, on average.
Year-to-date, the US frac spread count has not changed much until the first week of August. During this period, the US rig count declined by 15%. Given the slowdown in completion activity, HAL’s management believes that the electric frac spreads will be increasingly important in the coming days.
Margin Expansion Strategy
HAL looks to reap the benefits of a higher margin following a structural change and technology overhaul it initiated a few years ago. In the D&E segment, its drilling platforms are operating at a lower cost. For example, its FloConnect Surface well testing service is an automated platform that helps lower its overall operating costs.
Its Xaminer platform provides reservoir data and reduces subsurface uncertainty in the wireline business. Automation and remote operations will bring about further reductions to its operating costs, which will help D&E margins expand despite the quarterly fluctuations and seasonality.
Additionally, in Q2, it initiated the SAP S4 upgrade program, which would complete by Q4 2025. Through the use of advanced analytics, it will improve efficiencies and reduce costs. Total project investment is expected to be ~$250 million. While the costs to implement the project can lower costs in the near term, its margin should benefit in the long term.
New technology update
Our previous update discussed how various upstream operators used Halliburton Landmark’s DecisionSpace 365 applications. During Q2, the Landmark software business acquired Resoptima, which provides ensemble modeling at the reservoir level. The acquisition can accelerate Landmark’s next-generation reservoir modeling technology adoption.
HAL’s Q3 forecast
In Q3, Halliburton expects its Drilling and Evaluation division to increase by ” low single digits” while its operating margin can decline by 25 to 75 basis points. The Completion and Production division revenue and margin can remain flat “in Q3 compared to Q2. Compared to a quarter earlier, the quarter-over-quarter growth expectations have been lowered in these segments.
Key Q2 Drivers
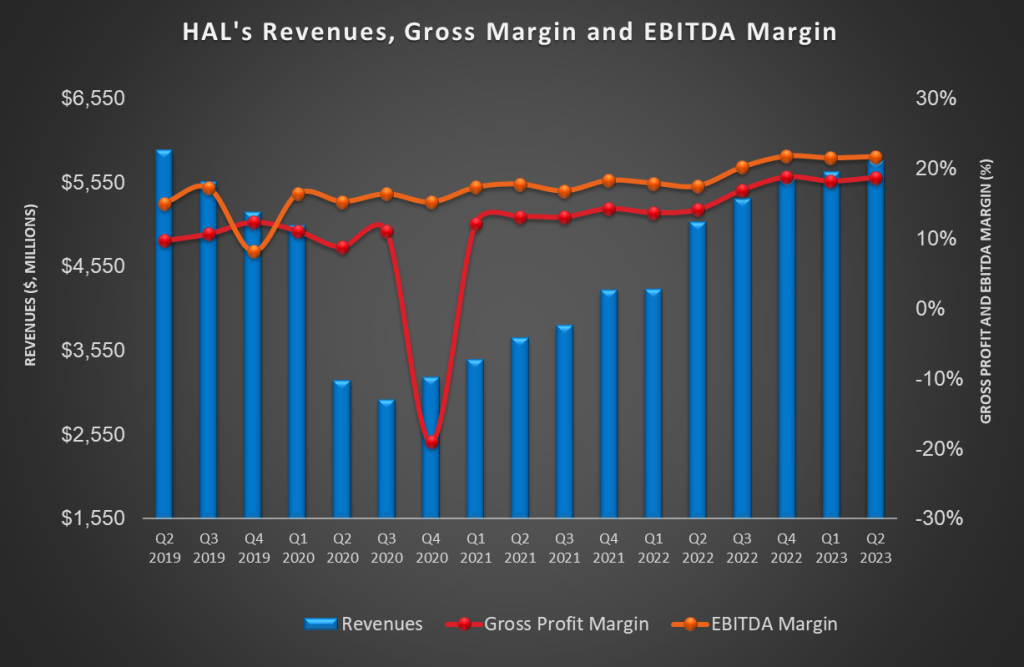
Geographically, the company’s North America witnessed revenue contraction (2.5% down) in Q2, while Latin America recovered and saw the sharpest rise (8.6% up). Lower stimulation activity in the US onshore resulted in the North American topline fall. However, increased artificial lift activity and product service lines in the Gulf of Mexico partially mitigated the loss. On the other hand, revenues from Latin America were up due to higher completion tool sales in Brazil and activity improvements in Mexico and Argentina.
Between the two operating segments (Completion & Production and Drilling & Evaluation), the C&P segment saw its operating margin expand by 80 basis points. In comparison, the operating margin was steady in the D&E segment in Q2 2023 compared to a quarter earlier.
Cash Flow & Balance Sheet
HAL’s cash flow from operations increased by 260% in 1H 2023 compared to the previous year, led primarily by the year-over-year revenue rise and improvement in working capital. Although capex, too, increased, it did not have much effect, and free cash flow (or FCF) turned significantly positive compared to a negative FCF in 1H 2022.
HAL’s debt-to-equity of 0.91x is higher than many of its peers (SLB, BKR, and FTI). Over the past 18 months, it has strengthened its balance sheet by retiring $1.2 billion in debt. It repurchased $250 million of common stock in Q2 to improve shareholders’ returns, totaling $600 million over the past 18 months.
Relative Valuation
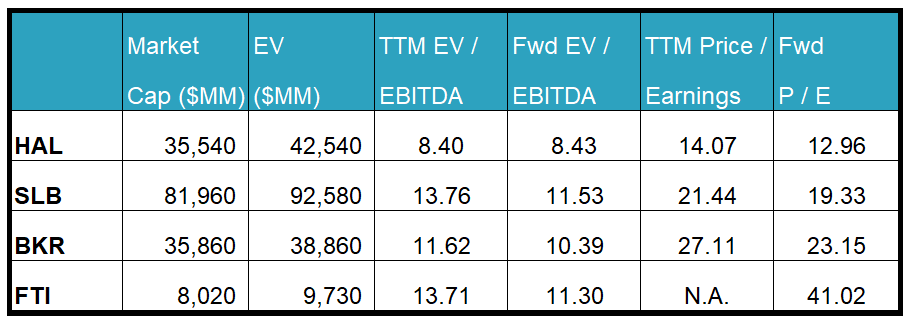
Halliburton is currently trading at an EV-to-adjusted EBITDA multiple of 8.4x. Based on sell-side analysts’ EBITDA estimates, the forward EV/EBITDA multiple is nearly identical. The current multiple is lower than its five-year average EV/EBITDA multiple of 11.3x.
The change in HAL’s forward EV/EBITDA multiple versus the adjusted current EV/EBITDA is nearly unchanged compared to a steep fall for its peers. This indicates the company’s EBITDA is expected to remain unchanged versus a rise in EBITDA for its peers in the next four quarters. This typically results in a lower EV/EBITDA multiple than peers. The stock’s EV/EBITDA multiple is lower than its peers’ (SLB, BKR, and FTI) average. So, the stock is reasonably valued versus its peers.
Final Commentary
In recent times, Halliburton’s management has sharpened its strategies, focusing on collaborations. These include a long-term strategic relationship with Vår Ene for drilling services. For its Zeus electric fracturing system, it signed many multi-year contracts in Q2. In further developing the strategy, its Landmark software business acquired Resoptima, which can accelerate Landmark’s next-generation reservoir modeling technology adoption.
So, the company now pursues a margin expansion strategy following a structural change and technology overhaul. It looks to push through the D&E margins despite quarterly fluctuations and seasonality. However, some headwinds remain, including lower stimulation activity in the US onshore. So, compared to a quarter earlier, the growth expectations have been lowered in Q2. To stabilize the margin, it has initiated the SAP S4 upgrade program. Although it will require significant investments, it can deliver margin growth over the long term. With strong free cash flow in 1H 2023, its shareholder returns and debt reductions are steady. The stock is reasonably valued versus its peers at this level.


