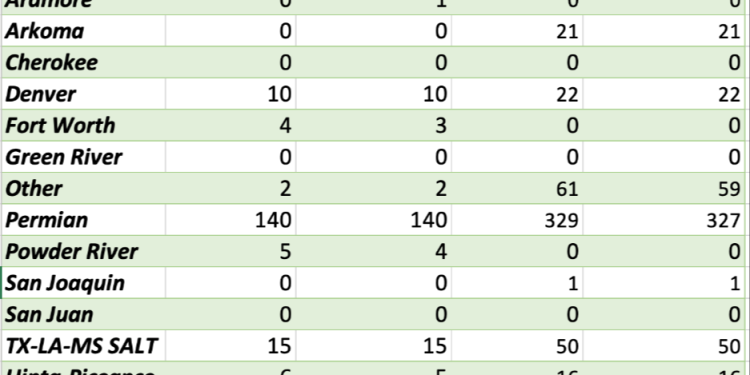
The completion activity took a bit of a step higher driven by natural gas and liquids rich regions. The Permian still remains well off the pace we were expecting, but we still see about 15-20 spreads being added as we progress through the end of August and into September. Margin protection and cashflow remains the focal point, and with another increase in OSPs by KSA- U.S crudes will remain competitive around the world. We were always going to flow into Europe, but the shifts by KSA will keep us active into Asia as well. There was another round of buying in November that will help support flows of 3.8-3.9M barrels a day.

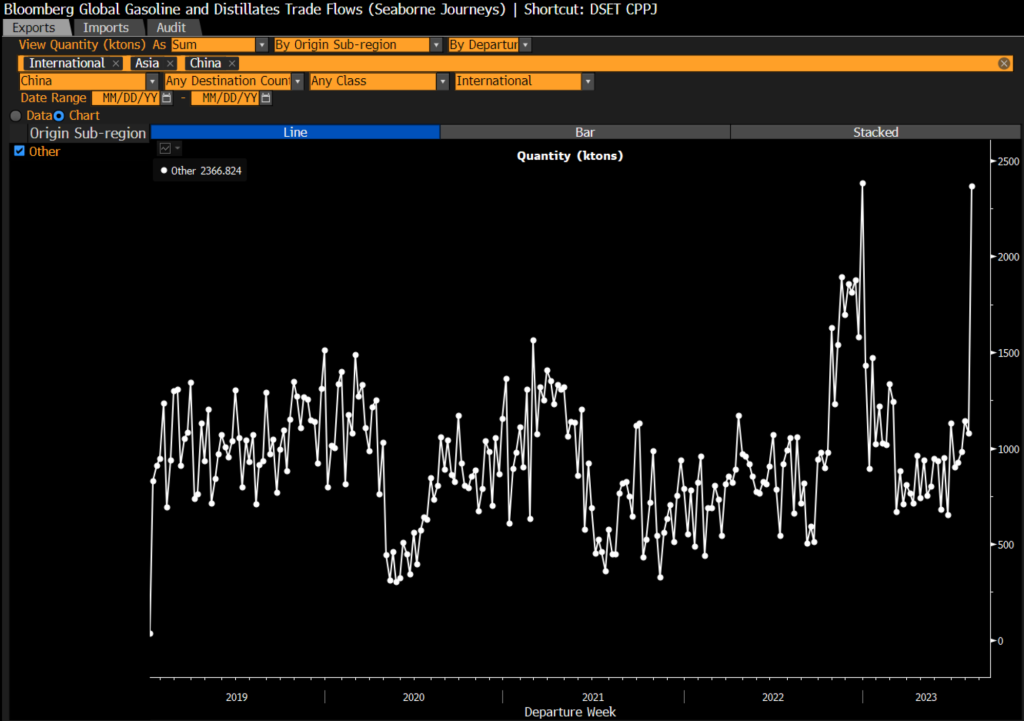
We have also stressed the importance of balancing crude exports with refined product flows. It’s no surprise to see refined product exports spike from China, Russia, and KSA even as crude exports slowed from the other two.
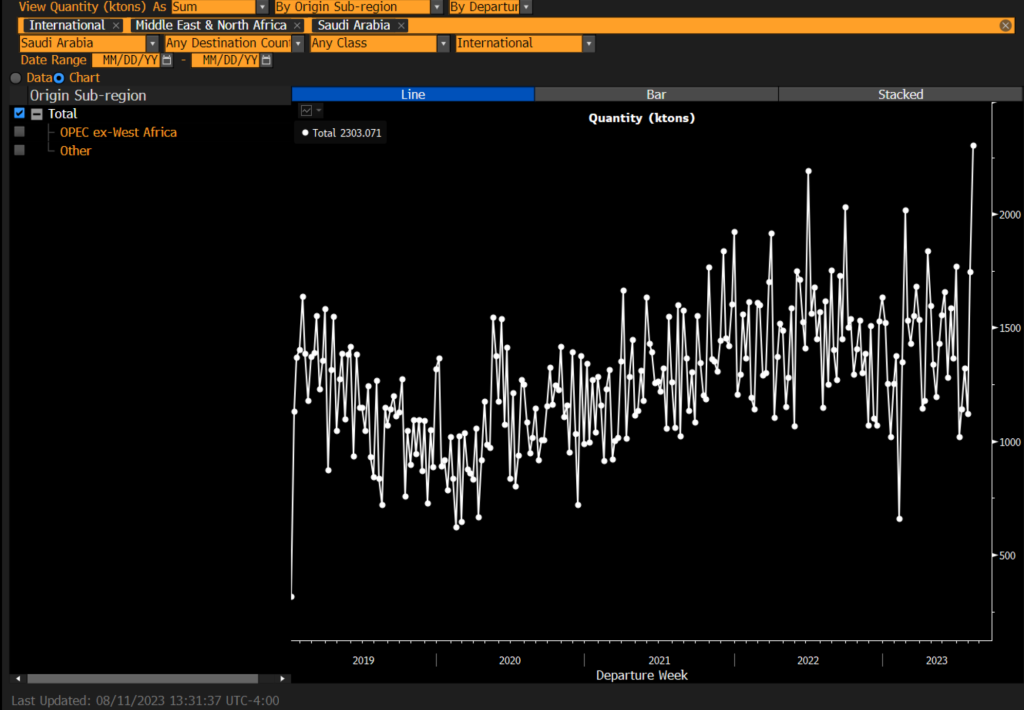
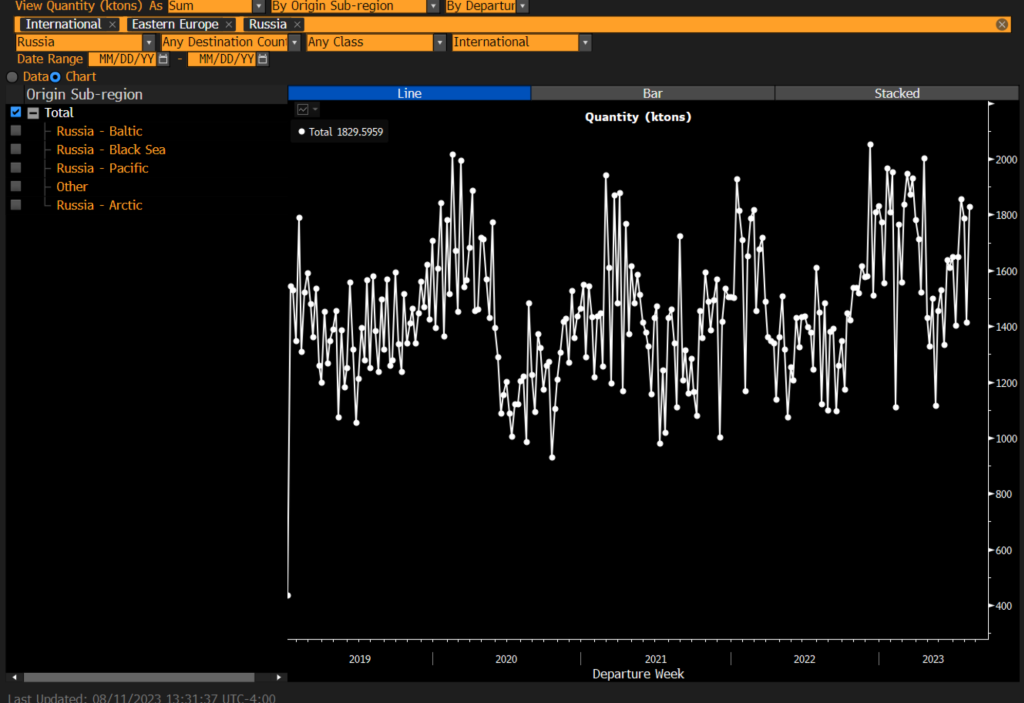
Companies that could have maximixed their exports in China ahead of the third tranche of quotas. Countries are looking to capitalize on the strength in the gasoil/ middle distillate market!
The IEA came out with their estimate on demand, and the market (per usual) believes this is 100% crude oil. For some reason, all of the major research shops love to talk about the demand numbers as crude oil- so the headline reads- 103M BARRELS A DAY OF CRUDE OIL DEMAND. This is 100% incorrect and misleading- the number consists of crude oil and liquids. The energy transition and growth of petchem demand is driving liquids growth, and it will remain the main driver for growth over the next 20+ years. The world has brought online a significant amount of new capacity since 2014, and it isn’t stopping with more facilities coming online over the next decade.
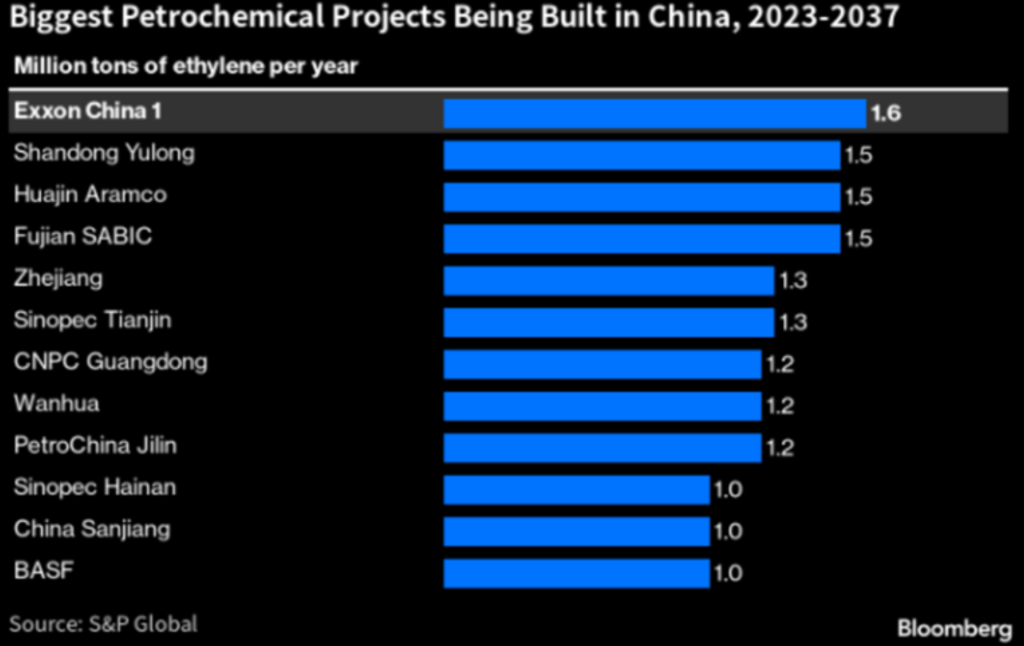
The growth for crude oil is a bit mixed as demand comes under pressure with a change in driving schedules and a cyclical decline in diesel/gasoil demand. Gasoline demand has softened around the world as demand levels remain a problem so to see the IEA say that crude demand has been 103M is a bit confusing. This is why we highlight the growth of petchem and the flows into the petrochemical world. The movement of gasoline is being impacted from a mixture of structural and cyclical demand while diesel/ gasoil is being hit by more cyclical and less structural.
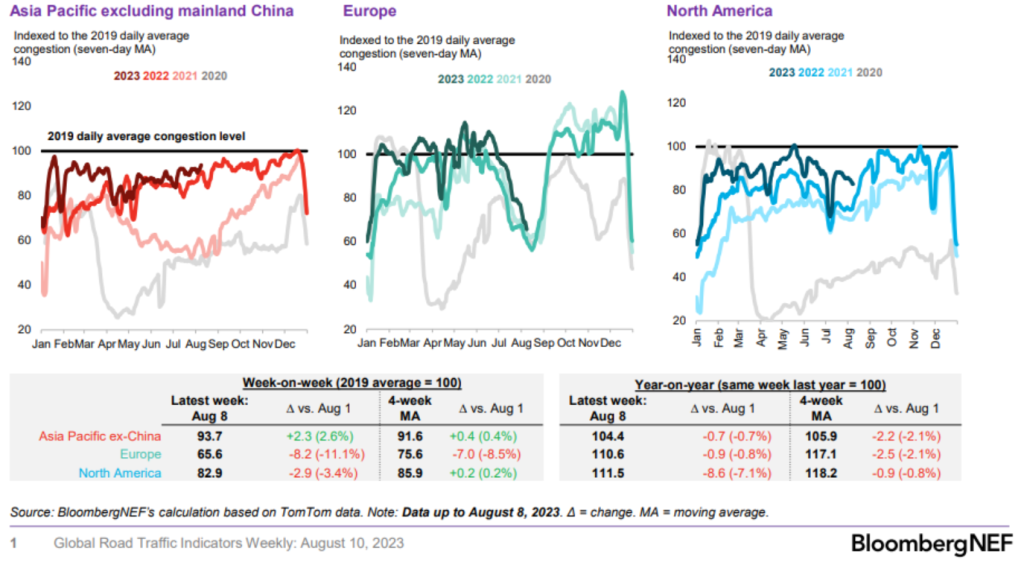
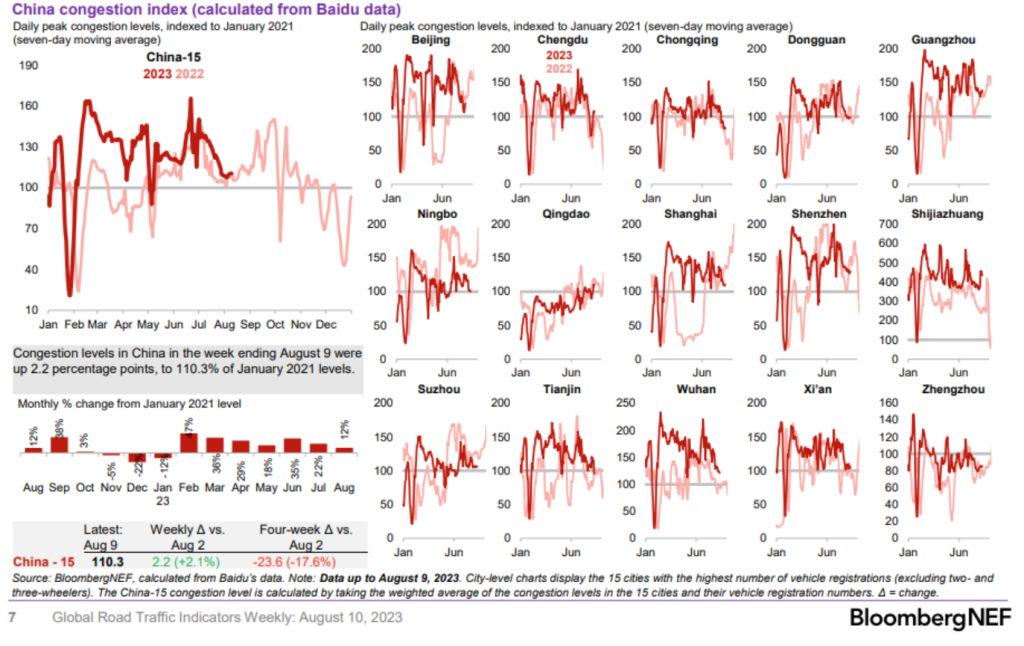
The big shift here on the gasoline front is the pivot on office visits, and the pivot on WFH and flex schedule. While we do see some gasoline demand recover from here, we don’t see a meaningful bounce back to “normal” but likely increase by 10%-15% without closing the full gap.
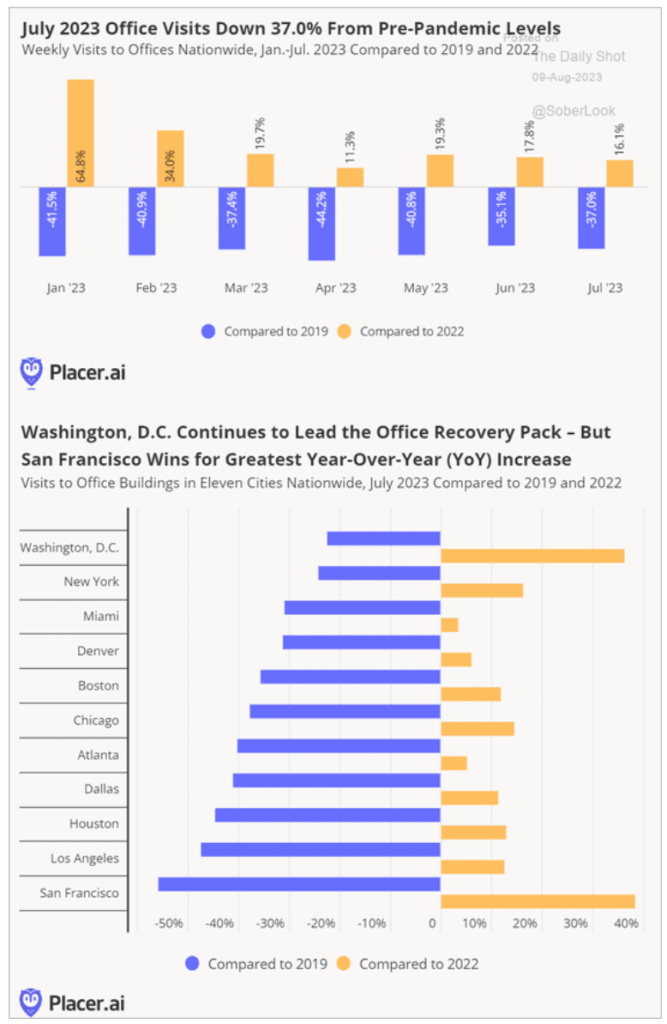

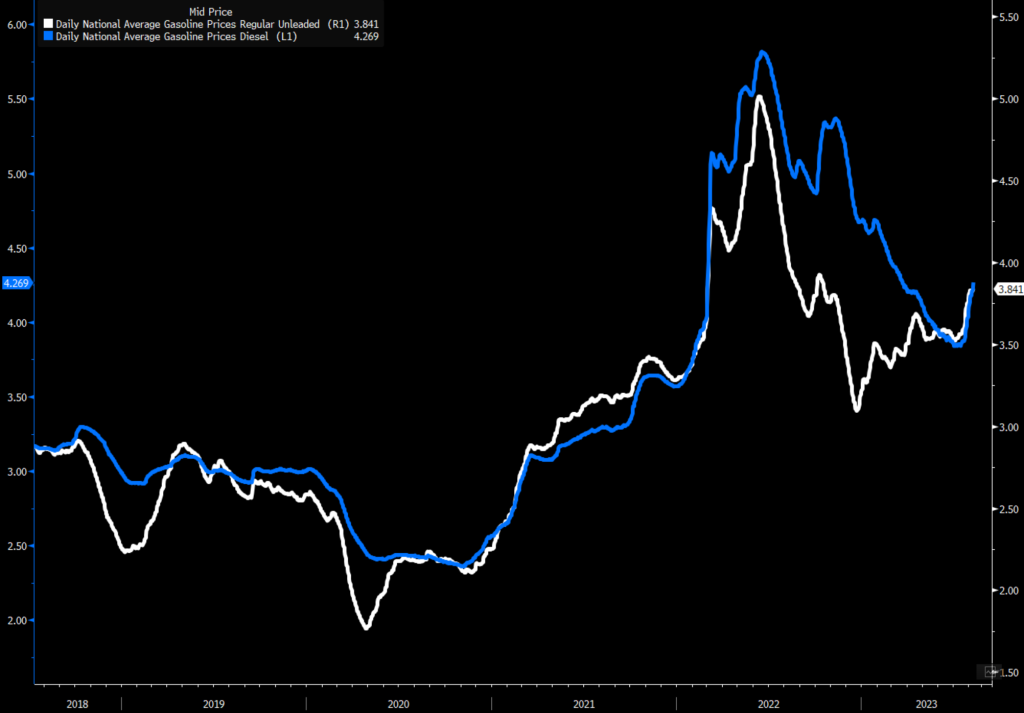
This is the structural change that is impacting multiple places, but the problem is also on a cyclical basis as prices remain much higher. Pricing of gasoline is a big problem going forward, which we see as a problem to underlying demand in the foreseeable future.
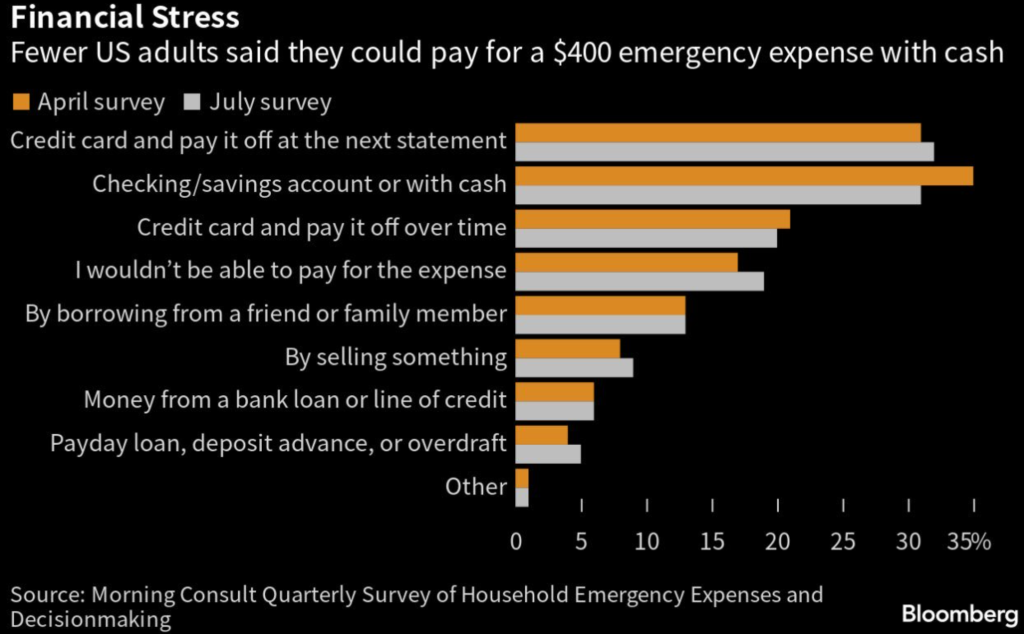
We are already seeing hit hard on the financial stress side with less people planning to spend over the next few months. Shrinking number of Americans can afford a $400 emergency expense … per recent MorningConsult poll, 46% of respondents said they could cover surprise expense (down from 48% in prior quarter); >1/3 said they’d need to use some sort of debt. The below highlights the tightness on emergency expense and savings tightness.
The next six months will see a net spending decline in a slew of discretionary spending spots. The below helps to highlight how these problems are expanding through the rest of the year. It’s hard to see how this doesn’t show even more weakness in spending and underlying retail sales.

On the diesel side, we have seen another drop in global manufacturing as well as trade when we look at the total market. Global manufacturing remained steeped in a downturn in July, as latest PMI data indicated a faster drop in new orders linked to a deeper slide in global trade flows and continued inventory reduction policies.

New export orders for manufactured goods fell at the quickest rate recorded so far this year. The monthly decline was also the 17th in a row, representing the worst prolonged period of downturn since the global financial crisis. The below shows the sizeable drop in global trade, which we see remaining weak throughout the year.

The order book also shows weakness in leading indicators. “A spell of falling inflows of new orders means producers have greatly relied on back orders to sustain production levels, resulting in falling backlogs, particularly as global supply chains have begun to improve.”

Backlogs have also dwindled down, which has been the lifeblood of manufacturing over the last 6-12 months. “Adding to the manufacturing malaise is a sustained trend of inventory reduction at producers amid weak demand and cost cutting measures, with July data signalling the fastest drop in input buying since January.”

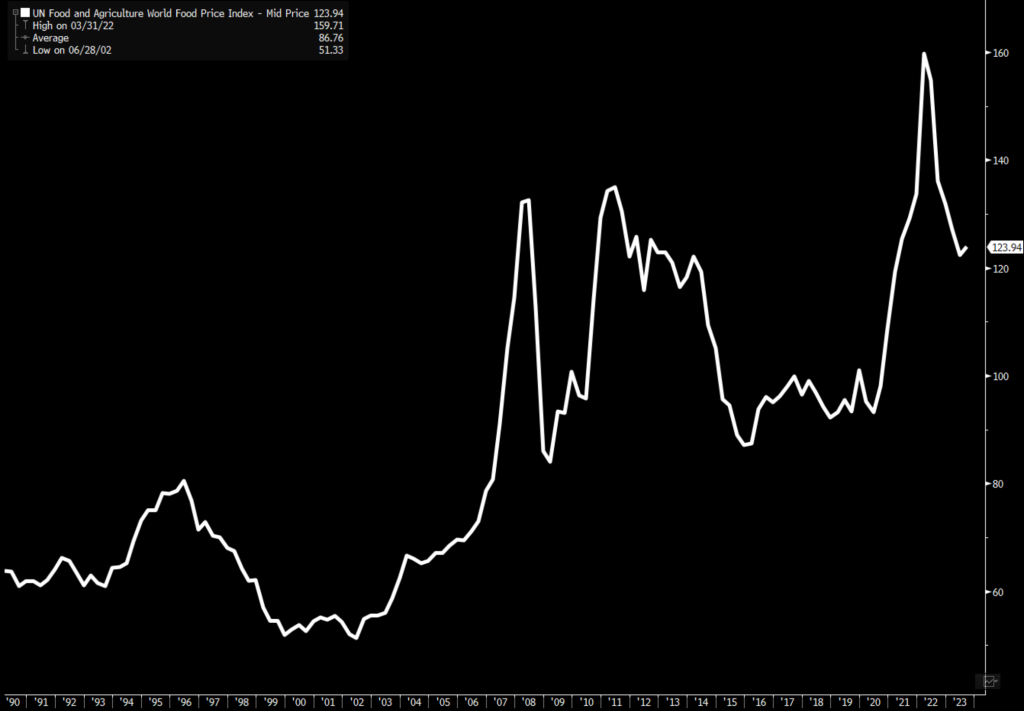
The pressure on inflation remains to the upside- especially when we factor in food. The biggest driver of the next cycle being rice as the tightness grows on a global scale.

The problems are expanding driven by reductions in India and Thailand. Essentially, two out of the three largest exporters have cut total exports and growing capacity.

This has pushed rice prices to 2008 highs, which is also getting worse with renewed problems in Chinese yield driven by floods.

Heavy rains lashing China’s northeast are ravaging crops in some areas of the country’s grain basket, threatening to increase imports at a time of rising food insecurity across the globe. Recent flooding has destroyed rice planted in parts of Jilin and Heilongjiang provinces, local media reported. The rains are expected to continue across most of the region this week as typhoon season continues to wreak havoc, raising the risk that more agricultural land will be inundated, according to the National Meteorological Center. The northeastern region, which also includes the province of Liaoning and Inner Mongolia, produces almost 30% of China’s grains, accounting for 45% of the national corn harvest, 60% of soybeans and 20% of rice. Farmers have already been forced to contend with heat waves over the summer, and the latest evidence that climate change is provoking extreme weather could prove devastating for the world’s top agricultural market.
The global balance of the “most important” crop has been falling for several years- not just this year.

The rise in pricing for rice and other crops is a huge problem for many emerging markets, and it will act as a tailwind for inflation. This will keep central banks on their heels with elevated rates around the world.

The prices driving higher across the commodity futures world is already showing up in food prices, but it’s just starting. The increase in food prices are just getting started, and will keep climbing over the next few months (at least).
On the China front, the debt problem is only expanding on multiple fronts. “China’s local government financing vehicles are showing more signs of stress, with a record number missing payments on a popular type of short-term debt last month. A total of 48 LGFVs were overdue on commercial paper, which typically carries a maturity of less than a year, up from 29 in June, according to a Huaan Securities Co. report citing data from the Shanghai Commercial Paper Exchange. Their missed payments amounted to 1.86 billion yuan ($259 million), versus 780 million yuan in June. The revelation is set to aggravate concerns about the financial health of LGFVs, which are mostly tasked with building infrastructure projects that may take years to generate investment returns. While none of them has defaulted on a public bond, their repayment risk has come under renewed scrutiny after China’s state pension fund recently advised asset managers handling its money to sell some notes including those from riskier LGFVs.”
The above just highlights the problems that are expanding on the debt level with little ability to avoid.
We will touch more on this next week, but the thing we want to leave you with is a huge write down on exports from China. “China made the biggest downgrade on record to the value of a monthly export figure, a move that could paint a more flattering picture of trade data in months to come amid weak global demand. The customs authority slashed $10.6 billion from the March data, when exports surprisingly jumped, as it reduced the overall value of exports for 2022 and early this year. The adjustment creates a lower base of comparison for year-on-year changes, resulting in more favorable growth rates for troubled exports. The revisions were highlighted by several analysts after the latest trade data was published on Tuesday. The adjustment to the March export figure, which brought down the value to $305 billion, was the largest revision in history, according to calculations by analysts at Soochow Securities Co. and Australia & New Zealand Banking Group Ltd.
The below chart puts into perspective just what the full write-down looks like over the last few years. This will help “future” comps, but impacts the GDP metrics of past years.

We will have more on this next week!

