In this week’s Monday Macro View, we will discuss, with the help of some really interesting charts, the impact of Israel Gaza conflict on the global economy. We have done this previously as well but I believe that it is important to take stock of where we stand every now and then given how fickle and precariously positioned the circumstances are. We will also see what is happening with the latest global macro economic indicators and that how it has started to turn the oil markets bearish – something we at PVN have been saying so from over a year now.
The oil markets so far have not been able to mimic, even closely, the previous spikes of e.g. Arab oil embargo or Kuwait invasion. There are multiple reasons for this:
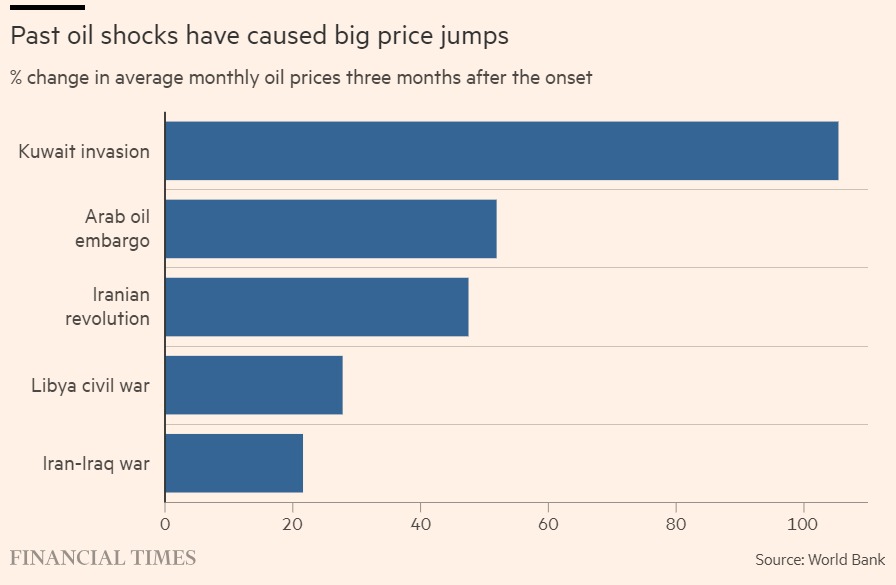
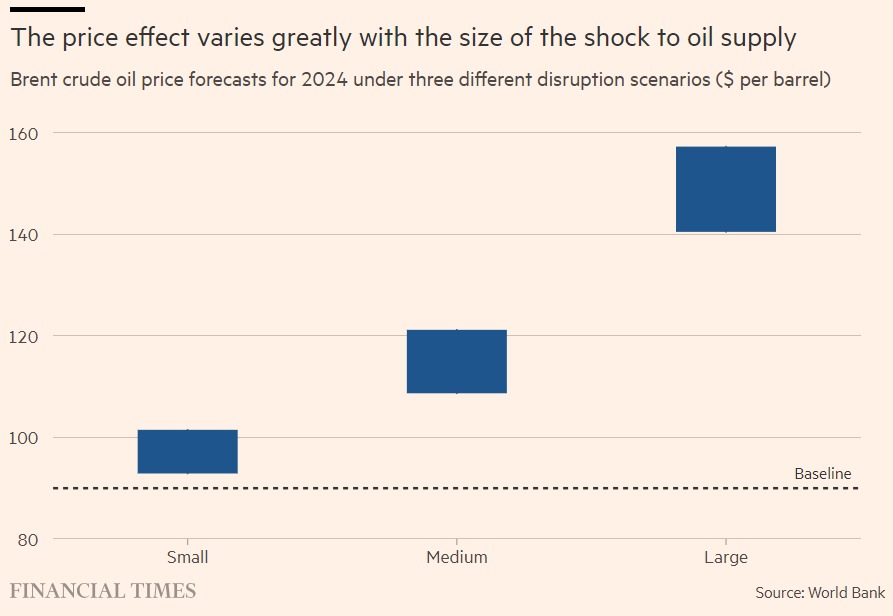
The World Bank recently released their Commodities Outlook where it outlines three scenarios:
- Small disruption: Reduction of up to 2 million barrels a day (2% of world supply). Estimated oil prices: $93-$102.
- Medium disruption: Reduction of 3-5 million barrels a day. Estimated oil prices: $109-$121.
- Big disruption: Reduction of 6-8 million barrels a day. Estimated oil prices: $141-$157. This scenario would bring oil prices close to their historic highs.
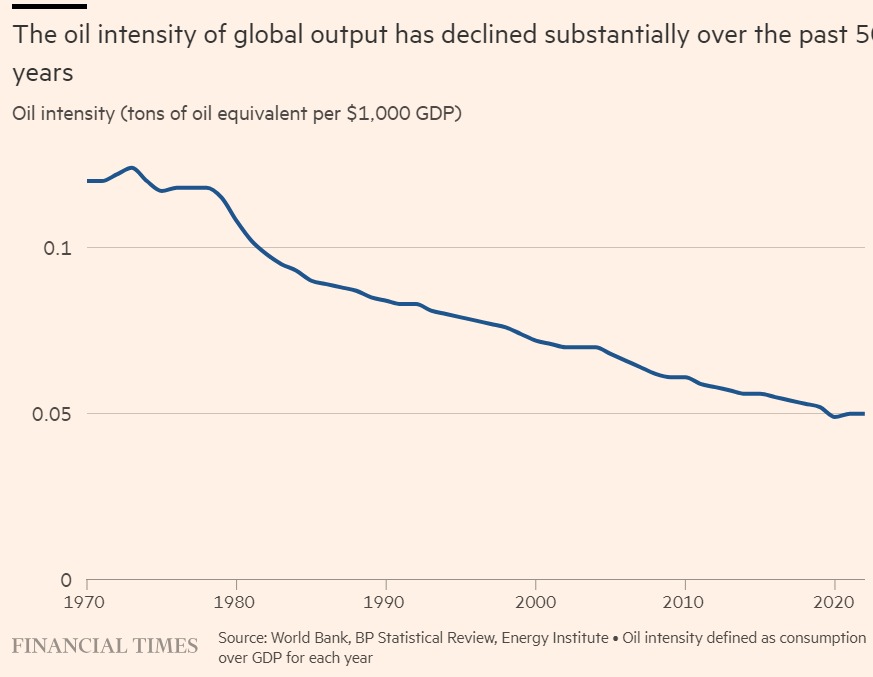
One of the reasons that despite the ongoing conflict, the impact on oil prices has been minimal is that oil intensity of global output has decreased by nearly 60% since the 1970s, and oil markets have become less vulnerable due to diversified supply sources, larger strategic reserves, and better coordination through the International Energy Agency.
Time will tell about the true impact of the current geopolitical conflict on the global economy. For now its scope and chances of further escalation remain limited.
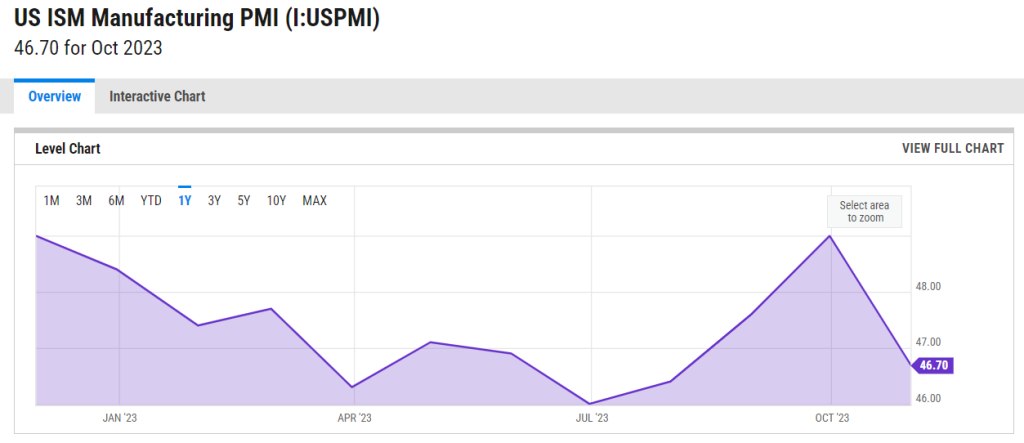
Turning our attention to the overall macro-economic indicators: Ironically, the major concern for global economy isn’t the Middle East conflict but the very extension of the slowdown that many observers failed to see since the start of the year. This was constantly being highlighted in various indicators that pertains to the Real economy such as industrial gas consumption in Europe, or manufacturing output in Germany and the U.S. Following is a chart that shows that business activity in the largest economy in the world took a dive delaying an expansion as the manufacturing PMI dropped to 46 vs expectations of 49.
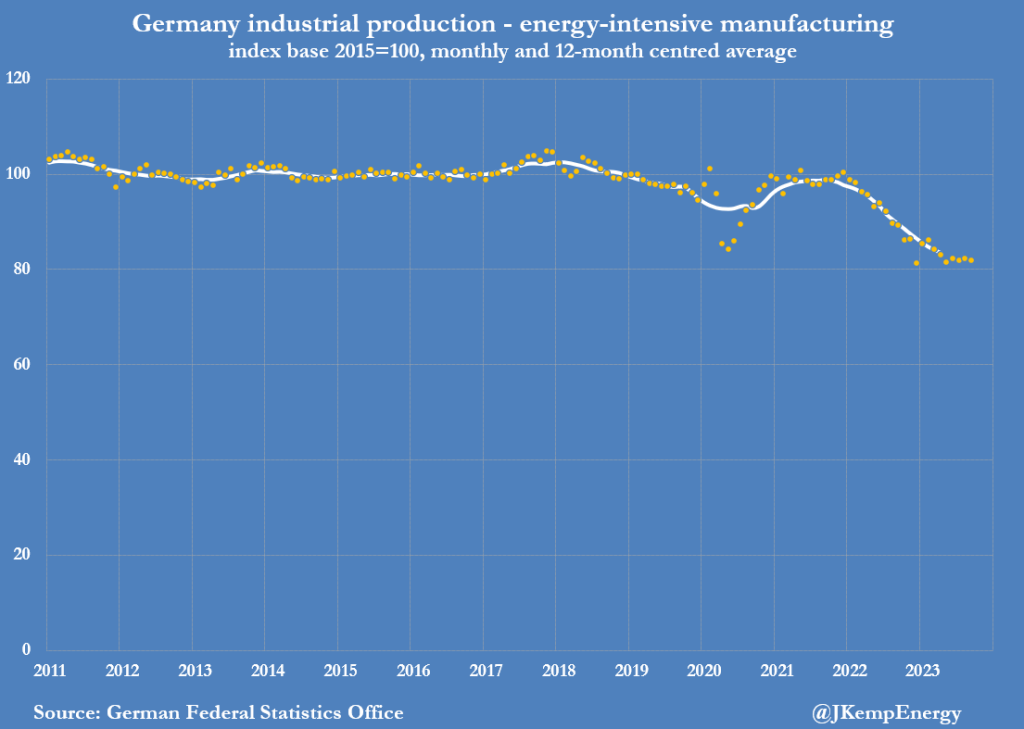
Eurozone continues to face multiple challenges and I have highlighted them previously in my research. Look at the chart below. It shows that in September, Germany’s energy-intensive manufacturing sectors continued to experience a downturn in production. The output has fallen by 17% since the beginning of 2022 and there are no indications of an imminent recovery. The high costs of gas and electricity are making it increasingly difficult for these energy-dependent industries to remain competitive.
In terms of the outlook for oil markets the data from ICE and CFTC shows a consistently bearish sentiment. According to John Kemp of Reuters, hedge funds and money managers were net sellers from the second consecutive week as concerns of a global economic slowdown take hold. Contracts equivalent to 73 million were sold reducing their position by a total of 274 million since 19th September.
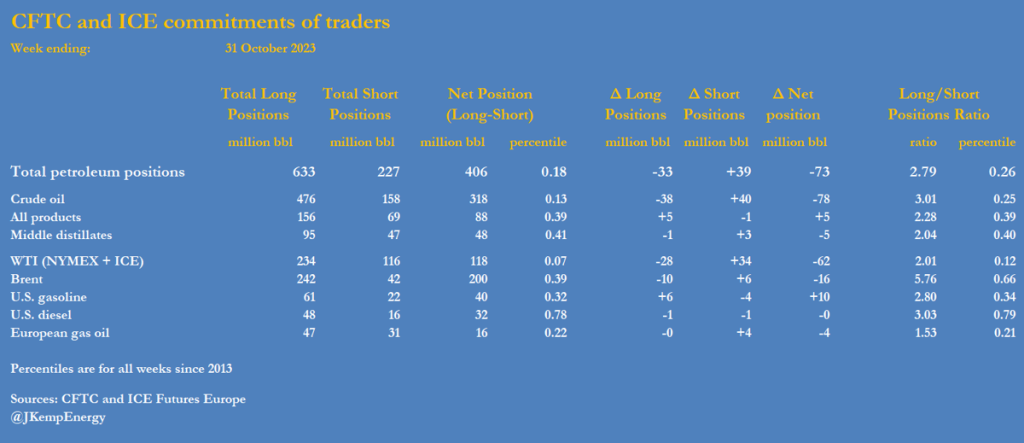
Moreover, hedge funds have grown increasingly negative about the future prices of diesel and other middle distillate fuels. These types of fuels are closely linked to economic trends and have been affected by the rise in interest rates and borrowing costs in major economies. Over the past nine weeks, with the exception of one week, these funds have been selling off their holdings in middle distillates, decreasing their total position by 56 million barrels since the end of August.
But the gas markets are looking different. There were a total of 533 bcf of equivalent contracts purchased by funds taking the combined positions to 943 bcf, highest in 75 weeks (May 2022).

