The energy markets remained volatile, but as we discussed on several client calls, crude was oversold at $77. We expected to see a bounce back to about $83, but for it to weaken back to about $80 over the rest of June. The spread remains between $77-$83 as the physical market improved, but not to a point where it can sustain $85 or push Brent higher. As we look into July, we think the current Brent range will hold of $77-$83, but start to get heavy and push on the floor of $77. This will give way to a range in August-Oct of $73-$78 as demand weakness results in bigger builds. A key factor to watch:
- Gasoline demand in the “core” driving season
- Diesel crack spreads in Asia
- U.S. crude exports
- We believe crude exports will struggle and result in bigger builds in PADD3.
We know more refiners have reduced runs- especially in Asia. China has been cutting runs across the board as their internal market struggles, and the export market is limited. The State Run facilities are the ones cutting the most at this point because the independent assets have already been well below seasonal norms. “China’s independent refiners — known as teapots — have struggled with lower margins for making fuels, despite access to cheaper barrels from nations such as Iran and Russia. That’s led to more maintenance, while OilChem predicts diesel yields are on track to fall to a historic low this month. Refiners will ramp up slowly from maintenance, but they are expected to have at least 1 million barrels a day of spare processing capacity that they won’t use due to poor demand, according to Mia Geng, an analyst with FGE. The consultant had predicted growth of 200,000 barrels a day earlier this year.”[1] The below chart puts into perspective just how slow refining has been in China’s Shandong. There is typically a ramp through May as assets come back from maintenance but given the low demand and elevated storage- refiners are setting new multi-year low run rates.

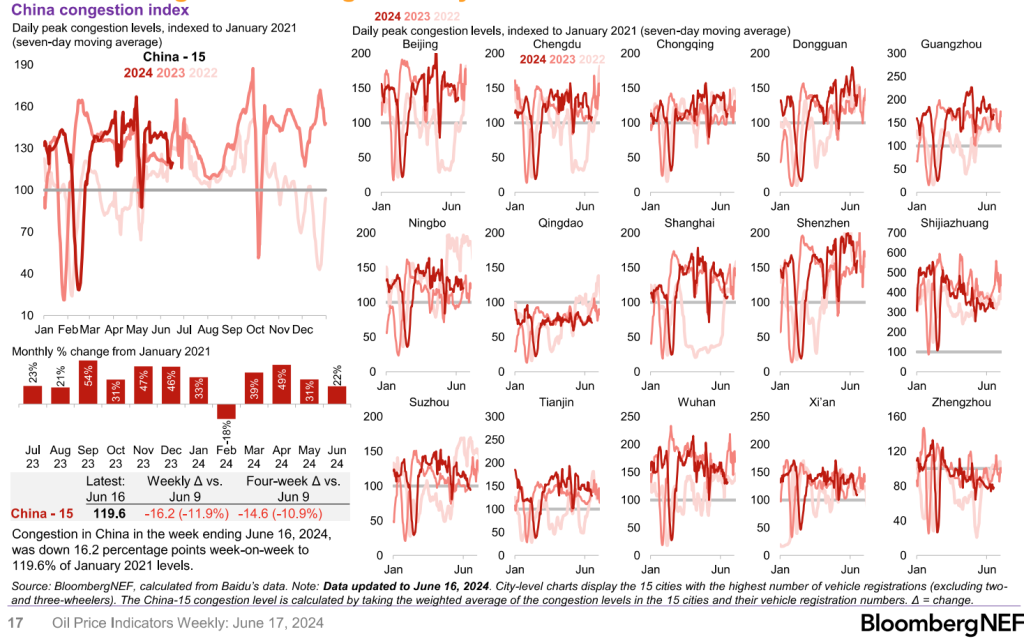
Given the margins in Asia, we expect to see refining capacity stay depressed in Asia as crack spreads struggle and storage rises. The pick-up in storage will keep Middle Eastern products flowing into the Atlantic Basin and put more pressure on U.S. exports and crack spreads. The supply side will remain fairly fixed over the next few months, but the demand side has degraded and will continue to over the next few months. The below gives a breakdown of Chinese activity during the Dragon Boat Festival, and we don’t expect to see a similar spike in June/July. Instead, we are expecting a move back to the May levels that will be held throughout the summer months. The bounce back from the festival week has been very slow to materialize as congestion and driving stayed at reduced levels. We expect this to normalize over the next two weeks, but not spike back as we saw in 2023. Instead, we think the 2024 May period is a good proxy for what current demand will look like over the summer months.
Europe’s gasoil shifted into backwardation, which shows a small pick-up in demand. This will quickly be filled by volume coming out of the Middle East but will help stabilize crack spreads at current levels. North Sea volumes have also seen some price increases, but a lot of this is European refiners coming out of turnaround. There have also been some lower freight rates recently that helps the economics versus other grades in the market. “It’s moving…wider diesel crack spreads in Europe are supporting middle distillate-rich grades from the Meds, even and handful of cargoes heading for Asia. Despite the frenzy activity in the Meds, there are quite a lot of Aframaxes laying around, cheap freight helps.”

When we look at the Northwest Europe (NWE) refining margins, I think it’s important to put it all into context. Our base case has been a huge amount of pressure originating in gasoline, which will be pulled into PADD 1 (U.S. East Coast). The only saving grace is the gasoil market in NWE, but that will quickly be filled by Middle East volume and any competitive PADD 3 volume. PADD 3 is struggling to compete in the international market currently as ME volume continues to avoid Asia and push into traditional U.S. markets- especially Europe. This will pull down gasoil crack spreads as imports increase and storage normalizes as refiners increase runs and demand stays muted.

The broader market looks similar to NWE in terms of gasoline cracks falling rapidly, and I expect the U.S. gasoline crack to catch-up. We’ve already seen some pressure emerge, and it will only accelerate as demand stays muted, imports rise, exports fall, and storage builds. There are rumors that run cuts are being rolled out in PADD 2 and PADD3, but refinery run rates will remain in seasonally normal levels against historics. We expect to see this trend closer to 92%-93%, which is still well within normal ranges. It’s just a small pivot following the strong start in operations, but margins are contracting and U.S. refiners are looking to react quickly to it.

There have been some pivots lower across the market as countries reduce their imports of crude. China saw a tick higher, but this is more a restocking after sluggish imports. We don’t expect this to remain above 11M as refiners remain well below seasonal averages.

The biggest problem point is in Asia, where we’ve seen Shandong Independent refiners remain at seasonally record lows and Chinese state-owned refiners started cutting runs. State owned assets are just following the reductions from South Korea, Japan, and Singapore while India discusses reductions due to a soft export market. These reductions in run rates driven be weak cracks points to a demand problem (or economic issue) especially because it’s hitting diesel the hardest.
The run cuts in Asia will help keep a floor under disty, but the gasoline crack is where we see the biggest pain point. This will “weigh down” the total margin for Asian refiners resulting in a huge pressure point. It’s also important to note that the diesel bounce comes when there was some additional exports, which are likely fleeting with pressure on exports picking back up end of July through August/Sept.

Just to put the U.S. in context, gasoline has fallen rapidly and while disty stabilized- we don’t see a huge amount of upside as demand stays sluggish and exports languish.

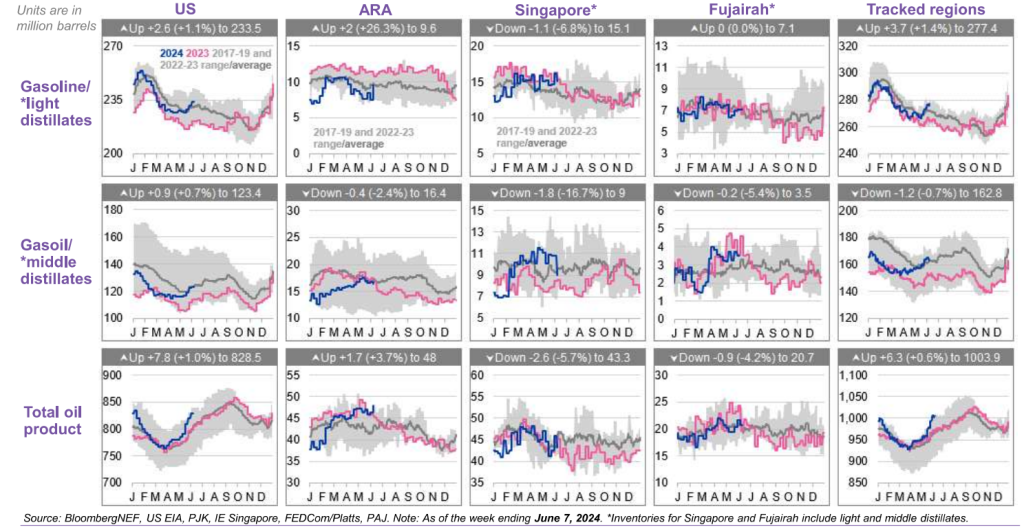
If we look at the last several years, diesel has carried the crack spread. This was driven by a surge in “re-stocking” goods and huge disruptions in the market. As global economic growth struggles, we are seeing a rapid deterioration in gasoil cracks driven by slowing demand and big spikes in storage. The data below has progressively gotten worse as product builds worsened around the world- especially in Singapore. Gasoil is the biggest place to watch at volumes trend well above 2023 and shift comfortably above seasonal norms. Gasoline isn’t going to save any location, and if gasoil cracks struggle, we see more run cuts occurring.
There is always a “hope” that demand will spike in the last week of June and first two weeks of July. The “core” of driving season this year should be June 27th this year because of where July 4th falls. If we look back to 2019 and 2022, there was a hope that July gasoline demand would “save us.” Instead, demand fell flat and resulted in weakness playing out through the remainder of July into August/September. If demand doesn’t meaningfully materialize by July 15th, I expect to see a bigger drop in crude prices. This will result in refiners entering maintenance season sooner and reducing crude demand.
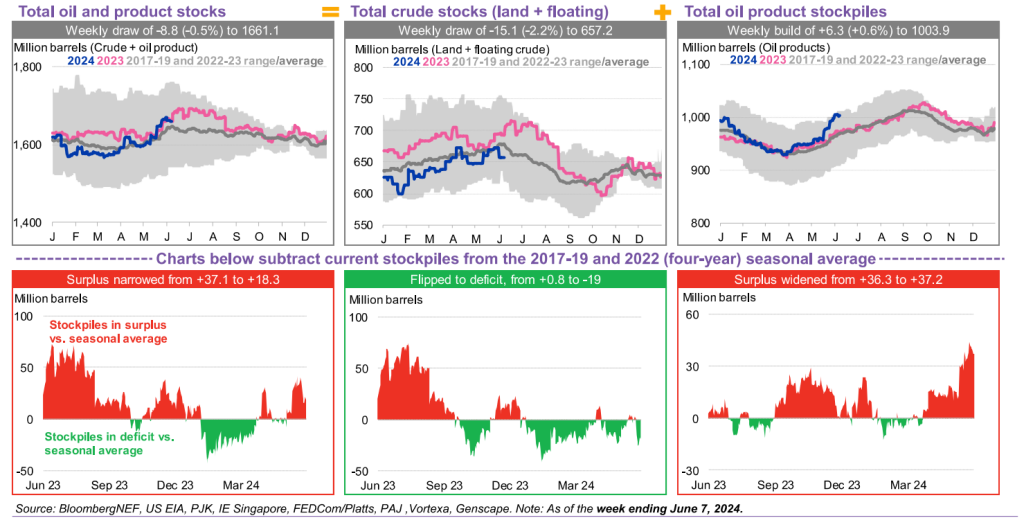
When we pivot to the broader market, crude oil products are getting close to taking out the seasonal five year high as crude levels stabilize. The biggest pivot in the market for crude remains the amount of crude “in-transit,” which still sits at very elevated levels. It’s below last year, but that still puts us at record levels.
The below chart puts into context just how much crude is currently sloshing around the water.

These barrels in transit will show up in floating storage and eventually transit onto land. There are some minimal disruptions in the GoM driven by the current storms pausing ship-to-ship transfers.
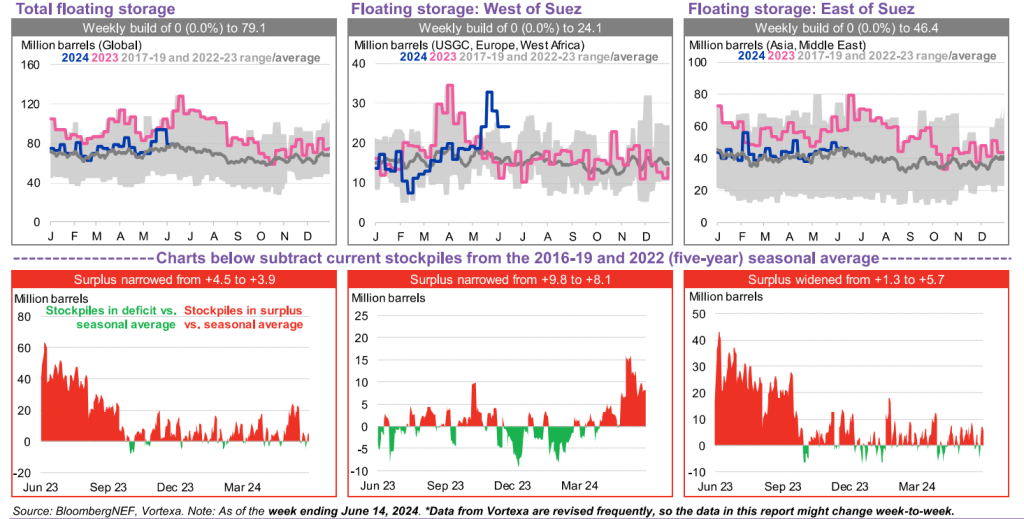
Floating storage has already been trending back above the seasonally “normal” levels, but as the crude in transit shows up mixed with slowing refinery runs- crude will see bigger builds.
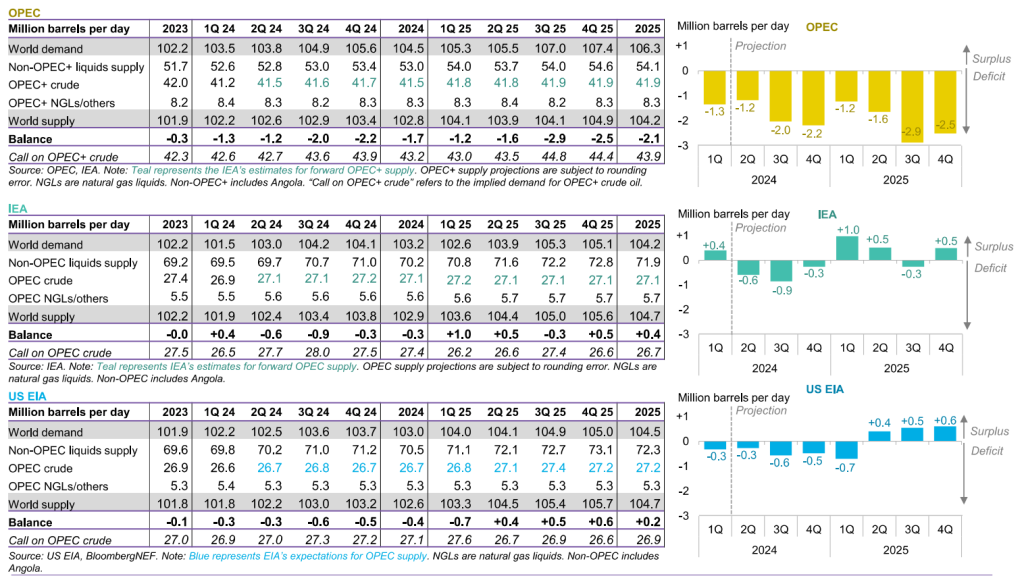
When we look at crude supply vs demand expectations, the EIA tightened their expectations because for some reason they expected OPEC to unwind their voluntary cuts. I’m not sure what market they were looking at, but it definitely wasn’t the one we’ve been watching. There is a broad expectation in the market that the 2H of the year will see an increase in crude demand. Based on everything we discussed above, I find it very difficult to see an increase in crude demand. If anything, I think it trends lower, which will essentially put us in a fairly balanced or slight oversupply in 2024. This is already a problem because many of the expectations already have net builds in 2025, which is going to be a problem for the OPEC+ cuts.
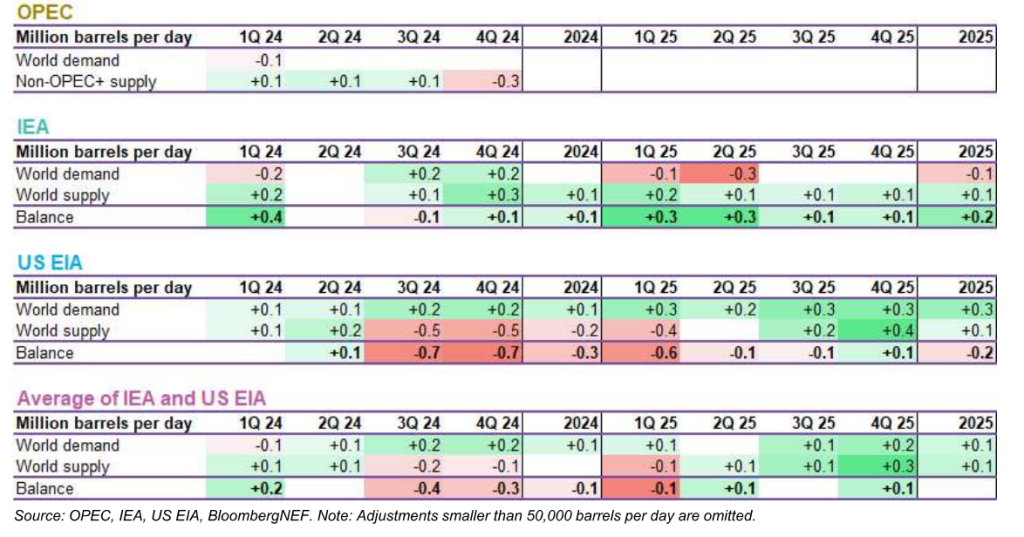
The day OPEC+ announced these cuts- I highlighted how difficult it would be to bring the volume back online. In order to avoid a sizeable collapse in pricing, it would take between 3-5 years before all the volume was back online. In the meantime, it allowed competitors to increase their production levels. I think we will see the below Q3 get adjusted lower as Chinese demand falls flat, and U.S. driving season doesn’t materialize to a meaningful level.
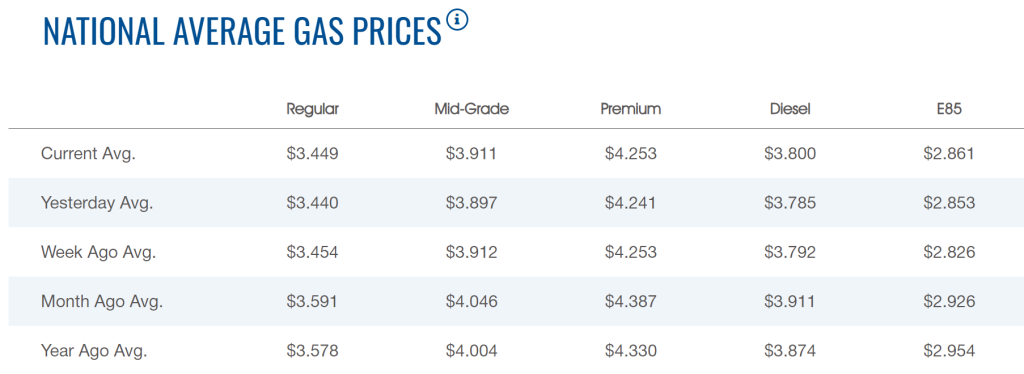
When we turn to the U.S., we’ve seen gasoline demand struggling to move higher. “BREAKING: According to GasBuddy data, weeky (Sun-Sat) US gasoline demand declined 1.4% from the prior week and was 1.1% below the four-week average.” On a positive note, gasoline prices have fallen below year ago levels. Given how the consumer has degraded, I don’t expect a huge spike higher- but it’s at least a positive development. I do expect prices to creep higher as we head into 4th of July, but we should see those weaken again in the back half of July into August.
Driving data came in a bit stronger, but this is driven from two key factors:
- Retail buyers accelerated purchases because prices are starting to trend higher
- July 4th is on a Thursday so June 27th will start to see a bigger bump. This pulls forward some of the demand as people extend their vacation to cover both weekends.
We will likely see one more strong push, which will be followed by a sizeable drop off the next two weeks. When you look at this at the 4-week rolling average, you will see it tracking below average. Ahead of July 4th, we’ve seen spikes approaching 10M barrels a day, so to see 9.386M isn’t a surprise at all. The bigger factor will be the follow through, which we expect to be lack luster. If you look at the GasBuddy data, the demand for the reported weak was much lower: “Another week of disappointing gasoline demand thus far… GasBuddy data showing week to date demand down 1.7% from last week’s rebound. Also down 1.4% vs the four week average.” This is showing an average below 9M barrels a day and something closer to 8.7M-8.8M. There will be another spike coming up for July 4th, but it will be spread across a broader period because it falls in the middle of the week. Usually, this spreads out when people travel, which begins as early as Thursday, June 27th. On the disty front the demand remains sluggish, and we will see a sizeable drop off next week. Trucking data improved throughout June, which is common on a seasonal basis. Inventory and consumer demand has been very weak, but businesses still need products and filled shelves. In recessions and slowdowns, movements of inventory are lumpy. Seasonally speaking, May/June are normally good months as well as vacation and beach spots also gear up for their consumers. The biggest question will be what does July and August look like? When we look at historics, I believe we will see a bigger slowdown resembling a slowdown we saw in February following a more robust January.

The below chart shows rejection rates: “Truckload Rejection rates broke above a crucial 5% level today. If this can hold through July 4th, we will see continued momentum. LAX, ONT, ATL, DAL are already in the 6-7% range.” If you look at January, we saw a similar bump that dropped off quickly, and I would expect to see something similar. If you look at 2023- there was also a run up in May/June, and it dropped off quickly. Given the disty crack, I don’t think we will see much follow through.

There was some reduction in storage this week as more product moved into retail, but the flows still remain weaker against seasonal norms. The arb between the U.S and Europe flow pulled more into the U.S, and we should see this continue through July 4th. As freight costs have fallen a bit and pricing improved in the U.S., we will see additional volumes hitting PADD 1. I talked about this several weeks ago- where I expected to see imports approach 1M barrels a day and hold at about 850k on a rolling average. So far, this view is on track.


An important factor for U.S storage remains our level of exports. Distillate exports are going to struggle to compete against Middle East flow into the Atlantic Basin. Even as gasoil moved into backwardation in Europe, ME flow has been quick to backfill leaving U.S. product in PADD 3. The crude side of the equation remains lumpy, but our view of 3.7-3.8M barrels a day of flow is playing out. This will leave more crude in PADD 3, which will cause net builds in the U.S.

The import picture is always lumpy, but the pause on lightering and ship-to-ship transfers caused it to be a bit more extreme in the Gulf.

I expect to see a sizeable drop in U.S. crude exports and a move higher in imports next week, which will show a bigger build across the U.S.
When we look at the broader physical market, we saw a recovery in flows from WAF and the North Sea. Nigeria was slow to cut prices, but they got more aggressive at the end of May and front part of June. This helped pull additional volumes into the market, which were also supported by Europe coming out of turnaround.

The above chart helps to show the seasonal nature, and it will be important to watch for follow through in the summer. So far, Nigeria and Angola flows are holding steady, but if they try to push pricing higher- I expect to see a quick pull back in demand.
Some of the calendar spreads strengthen- especially in Europe- but a lot of this was front running that originated from some of the trading houses. Gunvor and Trafi have been rumored to have front run some buying as European refiners came online. Given the softness in global disty spreads, I expect to see them unwind quickly. The move took advantage of the light open interest and European refiners coming online, but this kind of position can flip against you quickly.
We’ve been discussing the quality issues with TMX crude- especially when it comes to “tan” or acid. “ But 10 companies and refiners including Chevron (CVX.N), opens new tab and Valero Energy (VLO.N), opens new tab told a pipeline regulator the line’s crude quality specifications could deter their purchases. Trans Mountain last week said it would replace the existing pool of “Low TAN (Total acid number) Dilbit” with a pool of “Pacific Cold Lake,” or bitumen diluted with crude having a density of less than 800 kilograms per cubic meter. Pacific Cold Lake’s and Pacific Dilbit’s acidity will be limited to a maximum of 1.1 milligrams of potassium hydroxide (KOH) per gram, compared with an earlier limit of 1.3 mg KOH/g, the filing showed. High levels of acidity can corrode processing equipment and cause damage.”
There are only a handful of refiners around the world that can process their crude, and a majority of them are in PADD 3 (GoM). It would be much easier to get this crude to GoM through the Keystone pipeline, but that died a final death when Biden was elected. Instead, it’s being put into the Pacific where potential buyers are PADD 5 (California mostly), China, or GoM. I guess sending a ship around 1ks of miles is better for the environment than a pipeline!
The economic backdrop remains mixed but skews to the downside/ stagflation. I think the best place to start is with the Chinese markets. There has been countless articles and estimates talking about a robust Chinese economy driving crude demand. Instead, we’ve been very adamant that China has structural issues that limits any benefit from stimulus- my favorite comments about the Law of Diminishing Returns. “Signs that the national team may have stepped in to shore up the market failed to halt the gauge’s drop below the key level. The Shanghai index has fallen more than 5% since a peak in May amid Beijing’s reluctance to step up stimulus efforts. Asia’s largest economy faces increasing growth pressures at home, while major trading partners are imposing tariffs and restrictions on a slew of key Chinese exports. The index’s decline below the 3,000 level “indicates that the overly stringent policies introduced by the new China Securities Regulatory Commission head have shaken investor confidence and made investors panic in the short term,” said Shen Meng, a director at Beijing-based Chanson & Co.”[2] The stock market rallied on hopes that the stimulus would be enough to support a recovery. Instead, it created sellers into regulated buyers- which just means- there were no real buyers. The international community continues to avoid the Chinese markets, and the local consumer is struggling to manager their current debt levels limiting their purchase of stocks. “Foreign investors were sellers of onshore equities for eight-straight sessions through Wednesday, offloading a total of 30 billion yuan ($4.1 billion) on a net basis via the northbound link between Hong Kong and mainland stock exchanges. That’s the worst stretch since October.”
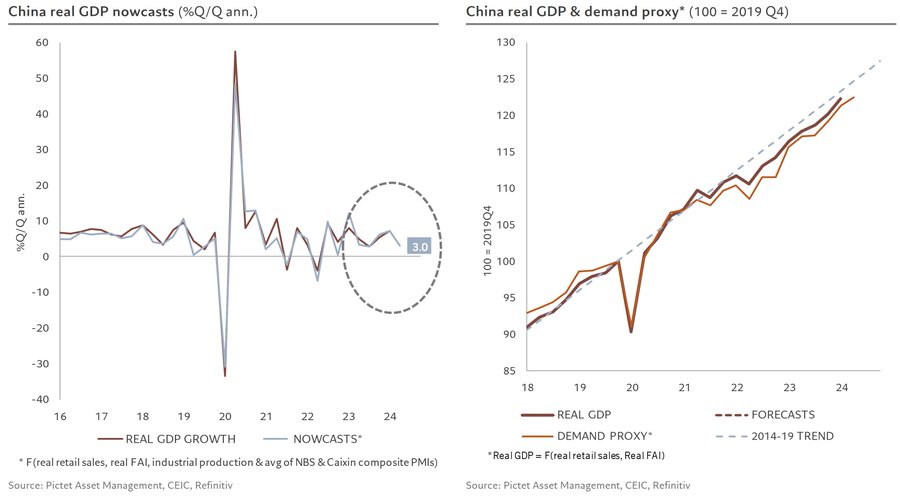
When we pivot to the recent data release, we discussed that May started ok but quickly dropped off and ended on a very soft note. This carried through into June and remains the case through the rest of the month. This will just keep the data underwhelming, which is against seasonal norms. “Chinese activity data for May remain quite mixed, as illustrated by the combination of key indicators pointing to a GDP nowcast for Q2 at 3% q/q ann. unchanged from the previous month and down from 7.2% in Q1.” The biggest overhang remains the “demand proxy,” which is rolling over further. This is showing up in the Asian crack spread and slowing state owned refiner output.

Industrial production has received the most support from the CCP in hopes this would be enough to drive a strong recovery. The push was for more debt support and stimulus into infrastructure and industry, but it hasn’t yielded the level of GDP growth hoped. Exports have struggled driven by low demand and “better” deals out of other countries with weaker currencies against USD. “Industrial production remains firmly above trend, up 5.9%y/y, but contracting sequentially by 1% 3m/3m ann.”
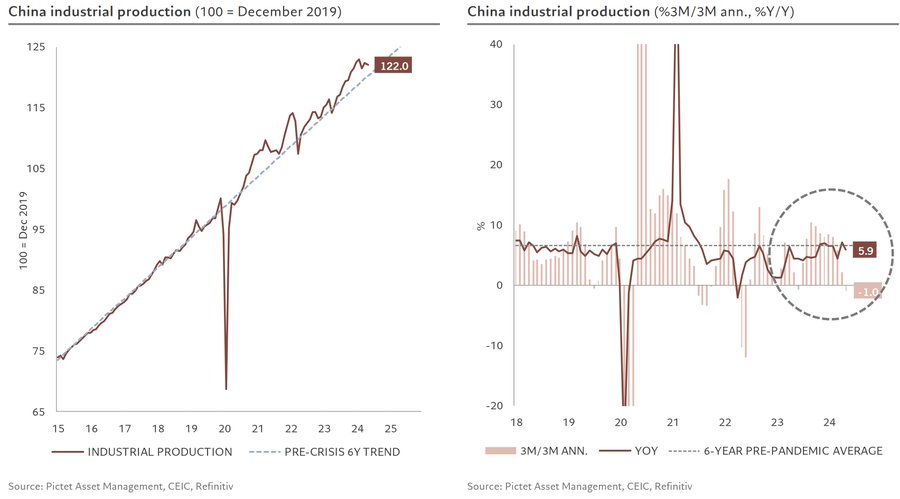
The retail side “improved” but it was still well off the pre-covid pace. There were some lengthy holidays that occurred during May, and they showed a willingness to travel but not spend to the same degree. Was the spending over last year- yes- but it was 13% (or 9% depending on the number you use) below 2019. The biggest issue is the underlying pace- because even with a “strong” number- it’s still FAR away from the pre-covid trend. I became very concerned about Chinese growth back in July 2019, and I was pounding the table about their issues in Oct 2019. COVID pulled forward my views, but it was always going to happen in this decade. “Retail sales volumes surprised on the upside, with an encouraging rebound over the month (+1.1% m/m) and compared to a year ago (3.4% y/y since 2.2%), but still remain below their pre-pandemic trends, both in growth and in level.”

The bigger problem is on the real investment side, which China needs to help drive the manufacturing sector. Even with the HUGE amount of public support, it has yet to reach pre-COVID levels and turned lower again. A large part of it is in the real estate space, which has only gotten worse in May/June. “Real investment spending fell in May but remains solid (+6.8% y/y), driven by the manufacturing sector, which benefits from public support for high-tech and the green economy, while real estate investment remains depressed, even if contracting at a slower pace.”

Here are some good charts and comments around the real estate markets: “The supply of residential space fell to new lows since September 2005, down nearly 70% since its highs in Q1 2021, while residential demand was marginally down on the month.”
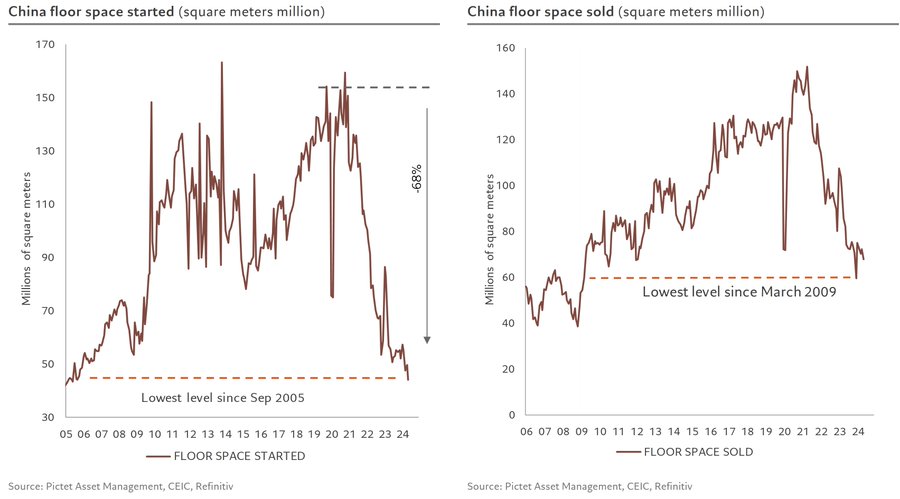
“In consequence, the stock of unsold homes has remained at historical highs and, pending the impact of measures announced by the authorities to reduce this stock, continues to weigh on house prices, down 4.3% y/y.”

We’ve been very consistent in our views that the PBoC would NOT be cutting rates any time soon. There isn’t a benefit in cutting rates at this point because debt demand is non-existent and liquidity is still elevated. They will remain on the sidelines. “Inconsistent with the Politburo’s guidance of an easing monetary policy at the end of April, the PBOC kept its main key rates unchanged (1Y MLF at 2.5% and RRR at 10%), mentioning in particular that the current real rate of 1.8% was lower than the natural rate of around 2%.” Just because the CCP wants there to be a cut- doesn’t mean the central bank will carry it out. The “real rate” is still lower just given the lack of demand for debt in the market.

From a housing standpoint, there doesn’t appear to be any real pivot in the Chinese market. Steel prices are soft- especially rebar- pointing to the issues increasing in the real estate market.

We’ve discussed the issues with China for years regarding supply vs demand side spending. Even as the comments from Trivium and the CCP point to a push to consumers, there is still CCP money and PBoC support for relying on exports. “China’s government should back a shift of exports toward developing countries, so it can find markets with the capacity to digest its industrial output and ease tensions with other trade partners, said an adviser to the nation’s central bank. “We have to pay attention to the way the international market responds” to China’s exports as its economic weight grows, said Huang Yiping, a member of the monetary policy committee of the People’s Bank of China. “We must come up with ways to reduce the conflicts,” he said in a speech in Shanghai on Thursday.”[3]
There are several problems with this view:
- Emerging markets don’t have the ability to absorb that level of output.
- As developed markets increase tariffs, this will put more pressure on export that will have to be sent into an already saturated EM world.
- USD strength against other currencies will support buying in India and other Asian nations.
China is trying the same tired tricks of boosting their economy, and it will lead to more problems over the longer term. The hope is for the consumer rebound- but we don’t see the same level of recovery as Trivium is hoping for. The refined product market is very telling at this point, and it will show up in the data across June/July.
Business activity is slowing.
- On a seasonally adjusted month-on-month basis, IVA only grew by 0.3%, down from 1% m/m growth in April.
- FAI was down 0.04% m/m.
However, it’s not all doom and gloom for China’s supply side.
- Private sector IVA increased 5.9% y/y, outpacing the state sector for the second consecutive month.
- Non-property related FAI held up strongly, with investment in manufacturing and infrastructure growing approximately 9% and 8% y/y respectively, slightly down from the previous month.
On a month-on-month basis, retail sales increased by 0.51% – the fastest m/m growth rate since October 2023.

Get smart: Commentators will lament the slowdown in industrial output and FAI, but we think they’re missing the forest for the trees.
- China needs to reduce its reliance on supply-side growth drivers – this structural readjustment necessitates a slowdown in IVA and FAI growth, and a concurrent increase in household demand.
- May’s print suggests the first part of this equation is occurring – but we’re still waiting for the rebound in household demand.
One of the biggest overhangs will remain real estate- “China’s new home prices fell at the fastest pace in more than 9-1/2 years in May, official data showed on Monday, with the property sector struggling to find a bottom despite government efforts to rein in oversupply and support debt-laden developers. Prices were down 0.7% in May from the previous month, marking the 11th straight month-on-month decline and steepest drop since October 2014, according to Reuters calculations based on National Bureau of Statistics (NBS) data.”
“In annual terms, new home prices were down 3.9% from a year earlier, compared with a 3.1% slide in April. China’s indebted property sector, once a key engine of the country’s economic growth, has been hit by several crises since mid-2021, including developers defaulting on debt and stalling construction on pre-sold housing projects.”[4]

Given the exposure consumers have to real estate, all of the above metrics are HUGE overhangs for their ability to spend. This doesn’t end well…
The biggest near term “issue” remains the Japanese Yen and rates. The BoJ is spending 100’s of billions to keep the Yen at weakness levels against USD not seen in 40+ years. They are just burning capital to fight and overwhelming battle they can’t win. U.S. yield is naturally capped from the carry trade of “sell XYZ foreign currency/ debt to buy USD and TSY”. Even as Yellen papers the town, we have rates fairly fixed at the moment. The BoJ/ Japan is the most exposed to the carry trade, which could adjust rapidly to stem the falling tide instead of spending Yen. The market is going to force them to “close” the carry trade that will cause a ton of U.S. paper to hit the market all at the same time. This will drive up yield and take away the last sizeable buyer of U.S. paper.
The next buyer of U.S. paper is a large magnitude higher on the interest rate perspective- which will cause a huge amount of bond volatility. This will cause a “panic” and people to readjust their margin expansion and cause their books to be massively overweight. The rebalance will create massive net selling of high beta stocks with outsized margin expansion against a new cost of capital.
The concerns aren’t lost on many of the banks- but lets start with Norinchukin (Nochu). The bank has finally admitted to billions in unrealized losses on its foreign bonds- many of which stem from the global CLO market. They are liquidating a huge amount of their fixed income holdings with an estimated 10T yen hitting the market to plug the hole. Realistically- this won’t be enough – and they will need an investor to step in to inject fresh capital. “Unless Nochu can find an investor to throw more good money after bad, the bank’s liabilities – farmer pensions – will be impaired (big haircuts). This would be the first and most notable example of Japanese pensioners suffering major losses due to monetary policy error; this in a nation where pensions have historically been sacrosanct and only invested in the safest of securities (40 years of ZIRP meant few had expectations for capital gains).” The question becomes- what’s the contagion across the board? How many pensioners lose their money, which would be a huge issue given the age of the country and savings oriented behavior.


In the U.S., we are seeing more and more banks turning to the discount window- which is something done when you are concerned about counterparty risk. Why are banks concerned? The answer is- duration risk and solvency. There are unrealized losses sitting on many of these balance sheets as CRE adjusts and curve exposures play out. The below chart puts into perspective just how much CRE debt is sitting on bank balance sheets… would you trust another bank or the Fed discount window?

When we look at the total level of debt, You can see the level of problems hitting some of the largest economies in the world. This is something that is a structural issue and will take YEARS to clean up.

U.S. housing risk is only rising with new data showing more cracks across the board. Remember, this is historical peak buying season for homes, but we are seeing a sizeable slowdown.

“The fall in building permits has contributed to a further fall in our real estate activity indicator, which is at its lowest for over 12 years, with 12 out of 15 indicators down.”

There is some hope that there is going to be additional investment in residential development and investment. The below puts into perspective housing affordability when you look across different periods throughout history.

The market doesn’t appreciate what is currently happening in the rates and currency arena. “China set the yuan’s daily reference rate at its weakest since November in a sign policymakers are loosening their grip on the currency. The People’s Bank of China set the so-called fixing at 7.1192 per dollar, an increase of 33 ticks, the most in about two months. The move comes as the dollar inches closer to this year’s peak, with traders betting on higher-for-longer interest rates in the US.”[5]
Central banks and investors are finally starting to accept where the Fed will keep rates over the rest of 2024. The Rupee is at it’s weakest point in over 20 years, Yen 40 years, and China weakening the fix rate gradually… but it’s moving.

This will be a huge issue for Emerging markets… but some are still holding out hope.
The leading economic indicator in the U.S. moved further negative again- and we don’t see that changing this summer. “Leading Economic Index from Conference board fell in May by 0.5% month/month vs. -0.3% est. & +0.6% in prior month.”

The focus will be on new orders- because we see it moving weaker again once things have balanced. There was a sizeable jump, but it ended as quickly as it came- which is common in a recession (as we discussed earlier.)

The last point to touch on is retail sales in the U.S.: “Nominal retail sales grew by 2.3% year/year in May … growth has been softening but remains healthy for now.”

May retail sales +0.1% m/m vs. +0.3% est. & -0.2% prior (rev down from 0%); sales ex-autos -0.1% vs. +0.2% est. & -0.1% prior (rev down from +0.2%) … control group +0.4% vs. +0.5% est. & -0.5% prior (rev down from -0.3%).

The pace is slowing down, and we see more pressure to the downside as activity disappoints this summer.

None of these components move quickly- instead it’s a slow burn until an event takes place. Is that event a closed carry trade? A failed bond auction? A run up in US TSY interest rates? Something will wake people up, but it will always come as a “surprise.” Realistically, we are already in a mild recession, but I believe it’s one that we will be in for an extended period of time. People/investors are asking the wrong question- it isn’t “Are we having a hard or soft landing?” Instead, it should be- “How long will the slow down last?”
- https://www.bloomberg.com/news/articles/2024-06-14/china-s-oil-refiners-are-slowing-down-after-decades-of-growth?sref=9yOLp5hz
- https://www.bloomberg.com/news/articles/2024-06-21/shanghai-stock-index-set-to-drop-below-key-psychological-level?sref=9yOLp5hz
- https://www.bloomberg.com/news/articles/2024-06-20/china-should-focus-exports-on-global-south-says-pboc-adviser?sref=9yOLp5hz
- https://www.reuters.com/markets/asia/china-new-home-prices-fall-fastest-clip-nearly-10-years-2024-06-17/
- https://www.bloomberg.com/news/articles/2024-06-20/china-weakens-yuan-fixing-to-lowest-since-november-on-fx-stress?sref=9yOLp5hz


