Market Outlook
We have already discussed Nabors Industries’ (NBR) Q2 2024 financial performance in our recent article. Here is an outline of its strategies and outlook. NBR received many rig awards and executed rig deployments during the quarter, reflecting the international drilling expansion and the company’s international strategies. The company expects to deploy five more rigs, of which the first three units will be deployed by 2024. Its incremental rig awards are spread across various geographies, including Asia, MENA (Middle East and North Africa), and Latin America. The management estimates that these regions will require 30 more rigs. With growing volume, pricing, too, has been affirmed.
In Q3, NBR expects to benefit from the contribution of the two newbuild startups in Saudi Arabia. It expects to deploy two more SANAD (a joint venture in Saudi Arabia) newbuilds. Saudi Arabia’s Aramco has requested six more rigs for deployment in 2025 and 2026. Investors may note that Saudi Aramco recently announced $25 billion of contract awards for natural gas development.
In Algeria, Nabors targets one rig startup during Q3 so that by 2024, it can deploy four rigs in that region. In Q4, it expects to start up two units redeployed to Argentina from the US and three rigs. All three are expected to commence operations by early 2025. It also expects to provide substantial drilling solutions. It also received formal awards for the three rigs in Kuwait for work starting in 2025. Kuwait, however, presents a few operational challenges as it requires high-spec equipment and skilled crews.
Rig Count And Strategy
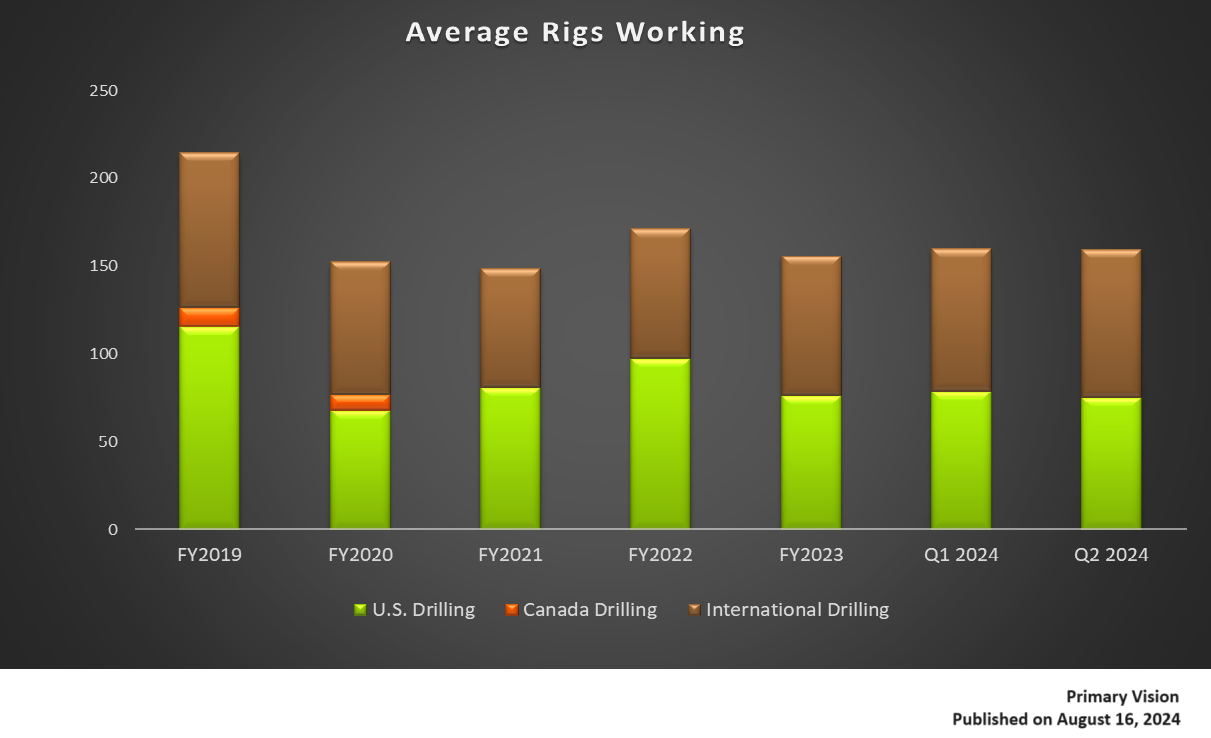
In Q2 2024, the average US rig count declined by 5%. Despite the weakness, leading-edge pricing for high-performance rigs has remained stable. In Q2, NBR’s average daily rig margins declined by 400 basis points from Q1. Leading edge pricing, however, remained stable with daily revenue in the “low-to-mid-30s.” The leading-edge pricing has not changed much over the past year. So, the average daily revenue has remained unchanged at an elevated rate. Despite pressure on utilization, NBR’s high-specification, high-technology rigs offer values at this rate. In Q3, the company estimates the US onshore margin will range between $15,100 and $15,200. This rate is slightly below the leading-edge prices as rigs roll to new contracts.
The company’s NDS performance in Q2 marked a slight increase over Q1. NDS saw volume increases in casing running and managed pressure drilling. The company focuses on the third-party market to offset the effects of a depressed rig count in the US. Its Alaska and the US offshore businesses were resilient in Q2. A recent survey of the US onshore found the surveyed companies’ year-end 2024 rig count will be modestly lower than the total at the end of Q2. The decline relates to merger activity in the upstream industry, which was announced over the past few quarters. The operators not involved can keep the activity levels stable in 2H 2024. Overall, the operators remain cautious about their plans for 2024, particularly in natural gas-focused basins, but can exhibit a relatively high level of churn.
Financial Performance And Balance Sheet
Quarter-over-quarter, revenues in the company’s International Drilling operating segment witnessed a marginal rise in Q2, while the U.S. Drilling segment declined by 5%. Drilling Solutions witnessed a 10% sequential revenue rise. Its cash flow from operations strengthened in Q2 2024. FCF increased significantly (by 6x). Debt-to-equity (5x) was high as of June 30.
It plans to deliver FCF of between $100 million and $200 million in FY2024. During Q2, we refinanced a $350 million credit facility scheduled to expire in 2026 with a new $475 million facility that expires in 2029. Also, the accordion feature (upsize the line of credit) of $100 million was upsized to $200 million. This can be used to retire the $556 million outstanding in priority guaranteed notes. So, the company improved its debt profile as it reduced its credit exposure for the near term.
Relative Valuation
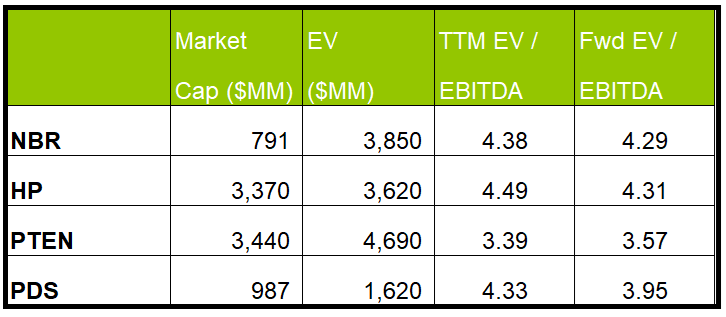
Liberty is currently trading at an EV/EBITDA multiple of 4.4x. Based on sell-side analysts’ EBITDA estimates, the forward EV/EBITDA multiple is slightly lower. The current multiple is significantly lower than its five-year average EV/EBITDA multiple of ~6x.
LBRT’s forward EV/EBITDA multiple contraction versus the current EV/EBITDA is similar to the fall in multiple for its peers because the company’s EBITDA is expected to increase as much as its peers in the next four quarters. This typically results is similar EV/EBITDA multiple compared to its peers. The stock’s EV/EBITDA multiple is slightly higher than its peers’ (NINE, PUMP, and ACDC) average of 4.1x. So, the stock is reasonably valued, with a negative bias, versus its peers.
Final Commentary
In the drilling industry, leading-edge pricing for high-performance rigs has remained stable. This is primarily because of additional rig deployment opportunities in international markets. NBR’s expansion scope includes the deployment of five more rigs in various geographies, including Asia, MENA, and Latin America. In Saudi Arabia, it expects to deploy two more SANAD new builds. The company also expects to provide substantial drilling solutions, including high-specification, high-technology rigs offer.
The US, on the other hand, still poses challenges following the lower rig count expectations from various operators. Lower capex can keep the US drilling operations in check, as witnessed in Q1. The company’s cash flows increased noticeably in 1H 2024. Although it has high leverage, the company refinanced its debt structure and improved its debt profile. The stock is reasonably valued, with a negative bias, versus its peers.


