
The U.S. shale industry continues to evolve in a landscape defined by fluctuating oil prices, investor expectations, and shifting political winds. In recent months, the industry has displayed signs of transformation as major players consolidate their positions and prioritize financial discipline over pure production growth. The latest data, including insights from Primary Vision’s FSC, paint a clear picture of an industry that, while resilient, is recalibrating its strategies to adapt to market realities.
First, let’s address the chatter about peak investment in shale. The consolidation wave that swept through the U.S. shale sector this year has been significant, with $100 billion in deals closed by September alone. This represents a substantial portion of the industry’s total deal activity and indicates the ongoing interest in expanding shale operations, particularly in prolific areas like the Permian Basin. Yet, with available acreage shrinking, some companies have been forced to look beyond the Permian for future growth. The need for expansion is evident, but the approach has become increasingly measured, reflecting an industry more focused on maximizing efficiency and profitability than on chasing rapid production growth.
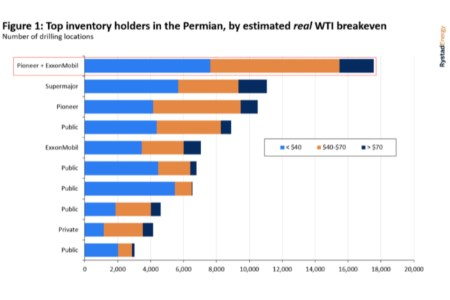
This focus on profitability is part of what has been dubbed as “Shale 4.0.” Companies are no longer just drilling for the sake of ramping up output. They’re drilling with a different purpose—maintaining shareholder returns and building long-term value. This shift can be seen clearly in the behavior of the top six companies in the Permian, which now control over 60% of the remaining commercial net oil resources in the region. As smaller players struggle to compete, the industry’s structure becomes one where the largest and most efficient companies dominate, making it a game of scale.
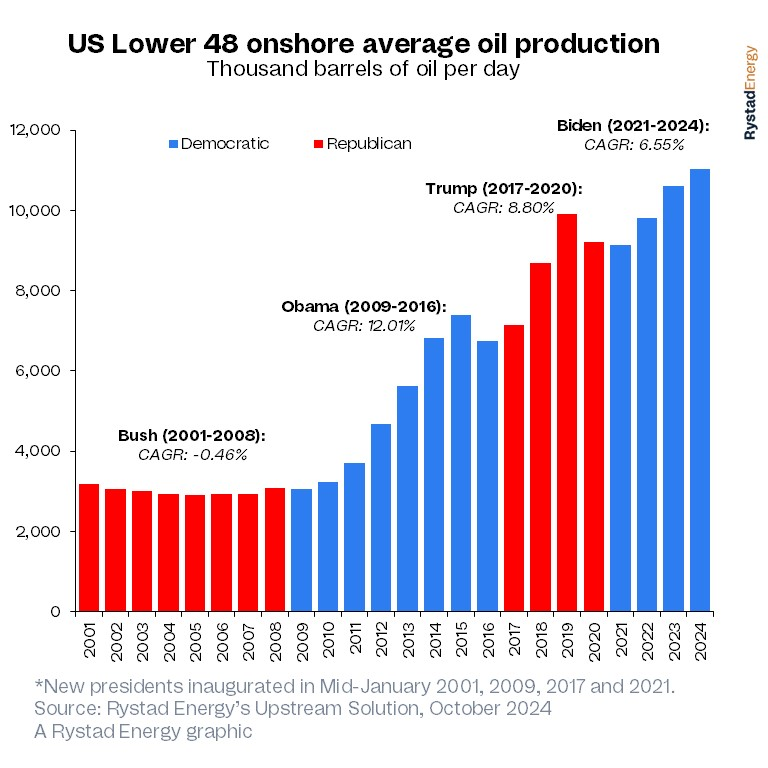
Despite the election uncertainties, the U.S. shale industry is primarily driven by market dynamics rather than political influence. Whether it’s Kamala Harris or Donald Trump at the helm post-election, the trajectory of shale production is expected to remain steady. Shale 4.0’s emphasis on returns and financial discipline means that even high oil prices may not result in the aggressive drilling booms of the past. With the link between oil prices and drilling activity somewhat decoupled, companies are cautious, focusing instead on measured investments.
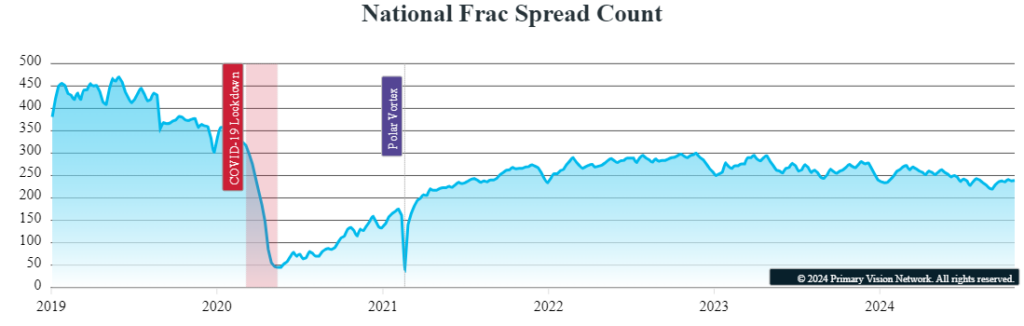
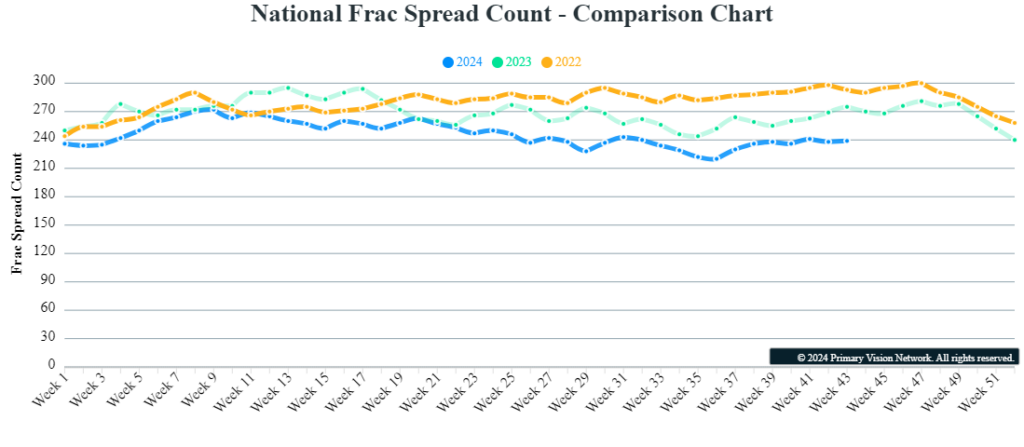
Looking at recent trends, frac spread counts currently stand at 239, with a weekly increase of 1, though they remain 36 below last year’s figures as per Primary Vision’s FSC. The frac job count is 228, up by 3 week-on-week but down by 9 year-on-year. These figures underscore the modest recovery in activity levels, suggesting that the industry is operating with a tempered growth outlook. This aligns with Rystad’s analysis showing that despite increased M&A activity, there’s no rush to expand output aggressively—partly due to uncertainties surrounding global oil demand and partly due to rising production costs.
The Permian remains a hub of activity, but there’s a notable shift in focus towards offshore investments and international markets as well. This diversification reflects the broader strategy of balancing short-cycle shale investments with longer-term offshore developments, a strategy that provides stability in an otherwise volatile market. Offshore oil and gas projects are seeing a surge in investment, outpacing growth in the shale patch, and signaling that demand expectations remain strong despite ongoing talk of peak oil.
The U.S. shale sector has also seen technological advancements aimed at reducing operational costs and improving efficiencies. Major companies have invested in digital and AI-driven solutions to optimize drilling and production. For instance, SLB’s collaboration with Amazon Web Services and NVIDIA highlights the industry’s move towards digitization. Companies like NOV and Halliburton are introducing innovative technologies, such as NOV’s wired drill pipe technology and Halliburton’s submersible pump systems, to enhance efficiency in well operations. These technological developments are becoming critical as companies navigate the challenge of maintaining profitability amid fluctuating oil prices.
It’s important to note that the geopolitical landscape still poses a potential risk to shale operations. Tensions in the Middle East and moves by OPEC+ could influence global oil prices, but the resilience of U.S. shale, with its diversified investment strategies and technological focus, gives it a competitive edge. Shale operators have learned to adapt to these external pressures, and their focus on financial discipline means they are better positioned to weather price fluctuations than in previous years.
In conclusion, while the U.S. shale industry faces challenges, it remains resilient and adaptive. The focus has clearly shifted to prioritizing returns, increasing efficiency, and strategically expanding through consolidation and offshore investments. The numbers suggest that despite the looming geopolitical uncertainties and fluctuating prices, the industry is here to stay—evolving in its approach but still central to the global energy landscape.


