
The crude markets cooled off a bit after a strong spike above $80 Brent, but as we highlighted in our previous write up- we expected the price to fall back in the $73-$78 range. We still believe that $75 will be the longer running average throughout Q1’25. Heading into 2025, I expected to see a bit more weakness on the demand side, which has played out so far. But, the additional sanctions on Russian and Iranian vessels has withheld additional supply. This has been able to offset some of the demand weaknesses. There was also some support from the frigid weather, but we have a small reprieve over the next week or two before another wave of artic air hits. This supported diesel, while we saw pressure on the gasoline front with snow hitting large parts of the lower 48 states.
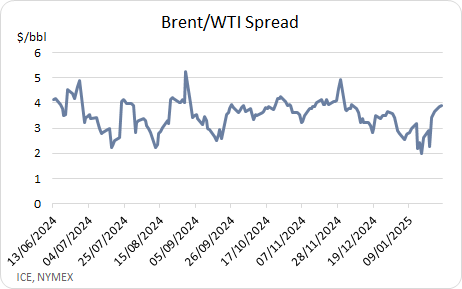
As we look forward, we don’t see much movement outside of the $73-$78 range with $75-$76 the average expected. We are also getting closer to turnarounds in February/March, especially in Europe that is facing sluggish demand already. In Germany, we have two refiners- especially Pernis so Northwest Europe isn’t going to see the same amount of crude. This will push more WTI into the water, which is why we’ve started to see some widening spreads. This will be an important one to watch as WTI prices at some steeper discounts to incentivize exports.
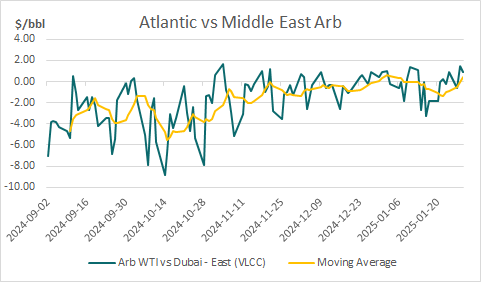
While we’ve seen some discounts in WTI, everything in the Middle East is holding their premiums. There was a lot of buying from China ahead of the Lunar New Year, so it will be important to see how this holds as China comes back from holiday. There is likely enough incentive to keep it at a premium ($2-$3), but unlikely enough to keep us at this $5 cash premium.

The premium in the Middle East will support WTI flows in the near term. WTI is landing almost $1/bbl cheaper in China than from the Middle East. This will support some flows into the region, but as companies increase run cuts- it will limit the total flow heading into Asia.
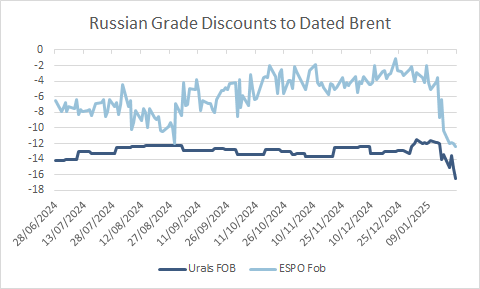
One of the big reasons is the huge drop in Russian crude grades with steeper discounts flooding the market vs dated Brent. There’s been pressure on oil exports, which is why they will have to increase discounts to push more into the water.
There is another way for Russia to get around the new restrictions, and it’s to export more cleaned products. Clean tankers aren’t subjected to the same restrictions and limitations as “dirty” tankers. This means that Russia can attempt to process more crude and increase the exports of product. The key products to watch are diesel and gasoil- these will be flowing aggressively, which could be adjusting the underlying volumes in the market putting pressure on crack spreads.
The U.S. is going to face in growing issue as tariffs are placed on many areas, we source heavy/sour crude. This will increase the cost for refiners, which will likely drive-up refined product prices. Just to put it into context: about 5.3M barrels per dead of heavy crude face 25% tariffs and/or increasing sanctions: Canada, Mexico, Colombia, and Venezuela. The U.S. has about 18M barrels a day of refining capacity, and just over half of that run rate is heavy/sour. So on average- we need about 10-11M barrels a day of heavy/medium sours… you can see how this can rapidly adjust the price at the refiner. Here is a good example:
PADDs 2 and 4
- Padd2/4 Refinery capacity: 4.8mbpd
- Refinery utilization: 90%
- Crude production: 2.8mbpd
- Crude imports from Canada: 3.0mbpd
- Crude exports to PADD 3 about 1.5M barrels per day.
This mix means the refiners were running about 30% light/70% heavy, which they could shift around a bit sending some additional heavy down into PADD 3. There could be a shift to run about 51% heavy/49% light, which would reduce Canadian crude needs from about 3M barrels per day to 2.15M. There would also be reductions into PADDs 1, 3, and 5, which could be as much as 1.4M barrels per day in reductions. This would total about 2.3M barrels a day of reduced demand or 50% of Canadian exports into the U.S.
Canada still holds a lot of the power because the U.S. refiners still require heavy/sour, and crude from the North is still easier to get versus some of the alternatives. It will be interesting to see how all of this plays out as we approach February 1st deadline for tariffs.
- $70 WCS with 25% tariff added makes it $88. So that $18 premium is about $0.22 to $0.30 per gallon gasoline and around $0.40 with taxes.
Sanctions are hitting hard to not only Russia as we’ve seen exports struggle, but it’s also pushed a lot of Iranian crude into the floating storage market.
Ever since the state-owned Shandong Port Group issued a preemptive ban three weeks ago on receiving US-sanctioned tankers, no vessels listed by OFAC carrying Iranian oil have successfully offloaded at its facilities. Iranian oil traders are looking for new solutions. (This is a great explanation from https://twitter.com/CRUDEOIL231/status/1884517005639966939.
- Recently, two Iranian tankers have docked at the Huizhou Port in southern China, which is a first. Three tankers have also changed their destination to Zhejiang Province in eastern China.
- Chinese traders have leased all the crude oil storage tanks at the Huizhou Port to discharge Iranian crude oil. Traders will then look for non-sanctioned tankers to transport the oil to Shandong Province, which will add to the shipping costs compared to the previous process.
- In addition, Iranian crude oil sellers have begun to move to ship Iranian crude oil that was previously stored in Dalian.
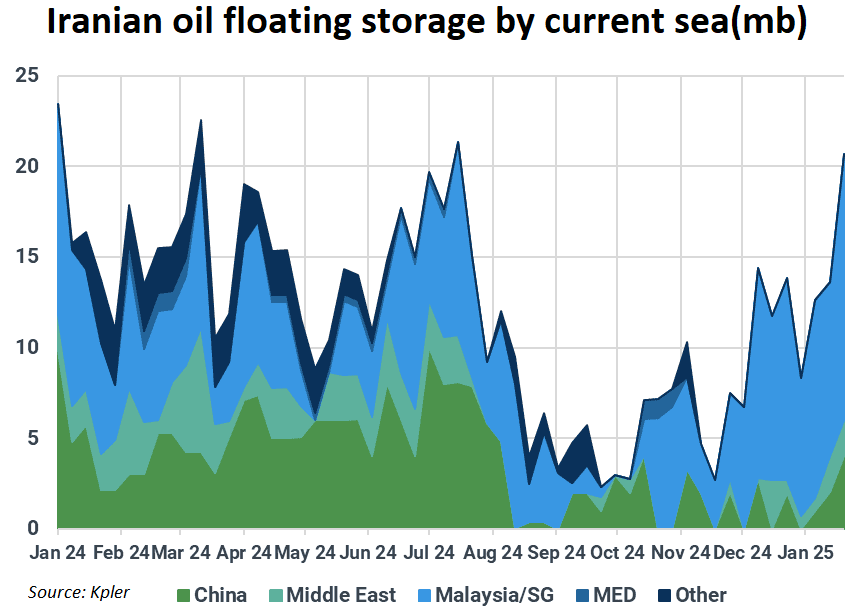
- At least three tankers are transporting crude oil stored in Dalian. Despite the desperate approach to move cargoes to China, there are still issues with tanker availability, which is why Chinese imports of Iranian crude oil dropped significantly in January. For the same reason, Iranian oil floating storage has surged to a 27-week high of 20.68 Mbbls, with over 70% anchored in Malaysian and Singaporean waters.
The difficulty of moving this crude into Chinese and other markets is one of the biggest reasons Dubai is trading at such a premium and WAF is clearing quickly. The speed at which WAF has sold slowed over the last 2 weeks as Asian refining margins have gotten hit hard. This is coming at a time where turn arounds are starting to increase.
- The weak refining margins in Asia, including those for gasoline, are hurting the profitability of export-oriented Korean refiners.
- According to what the refinery operator said, there are plans to reduce the utilization rate at the HD Hyundai plant in Daesan, South Korea, due to weak margins.
- They have postponed the discharge schedule for some small-scale cargo.
- South Korea’s GS Caltex will begin maintenance of its ~330kb/d Yeosu refinery at the end of February.
- This maintenance schedule had been brought forward from mid-March. The refiner is also planning to shut some or cut operation rates at secondary units that produce petrochemicals because of poor production margins.
- According to what the refinery operator said, there are plans to reduce the utilization rate at the HD Hyundai plant in Daesan, South Korea, due to weak margins.
- Asia Gasoil refining margins slipped by 20% since the the start of the week and hovered at nearly 2 month lows, closing at $14.5/bbl on Friday. Asia’s middle distillates markets weakened as the week progressed as some traders slowly cleared their position before next week’s holidays, with China refiners also selling off February spot sale cargoes.
Here’s a great physical breakdown:
- Cash Dubai’s premium to swaps fell $1.4 to $3.19/bbl. Asia complex refining margins recovered to 2 week highs of more than $2/bbl.
- North Sea: Mercuria bought two Feb 19-23 WTI Midland cargoes from Gunvor at Dated Brent plus $1.60 CIF Rotterdam. Mercuria bought a Feb 19-23 WTI Midland cargo from Shell at Dated Brent plus $1.65 CIF Rotterdam.
- Gunvor offered a Feb 9-13 WTI Midland cargo at Dated Brent plus $1.30 CIF Rotterdam. The average of WTI Midland was Dated Brent plus $1.54, equal to Dated Brent plus 64 cents on an FOB basis.
- Mercuria bid a Feb 24-26 Forties cargo at Dated Brent plus 50 cents FOB, up from Friday’s value.
- WAF: India’s IOC bought 2 million barrels of Nigerian Okwuibome crude from Vitol and 1 million barrels each of Nigerian Akpo and Angolan Mostarda grades from Shell in its latest tender for April delivery.
- That follows on from its tenders for February and March arrival, issued earlier in January, in which IOC bought 5 million barrels of West African crude in total, comprising Nigerian Agbami and Akpo, Angolan Nemba and Gabon’s Rabi Light.
- The sanctions announcement prompted West African crude sellers to lift offer levels, but upward price momentum hit a plateau as buyers were reluctant to pay up given steeper backwardation and higher freight costs.
- Otherwise on Angolan grades, at the end of last week one seller was offering March-loading Nemba at Dated Brent plus $1.50, while Olombendo was offered at Dated Brent plus $3.50.
West African crude will likely see some headwinds given the price premiums and slowdowns in broader activity. I expected to see some sluggish movement and a more of the premiums melting away.
The biggest issue remains on the product side of the equation as Europe and Singapore are sitting on very high inventories. The U.S. is a bit better, but it’s rapidly changing as mild weather impacts distillate runs. Early run cuts (maintenance pulled forward) will help adjust the product side, but it will also leave a bit more crude in the market.
In The U.S., we had a bit of a bounce in gasoline demand, but a large part of that was to refill the system following the recent winter weather. We expect to see another drop in gasoline demand as trends remain below seasonal averages.

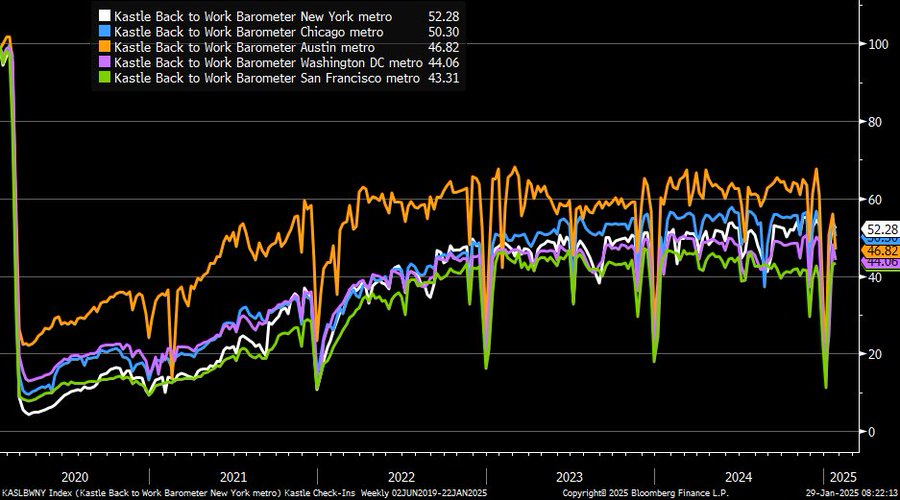
The cold weather has supported distillate and LPG over the last few weeks, but as we get a bit of a warm-up, this will also see a sizeable drop. Distillate will likely just fall back to the 5-year average, while gasoline falls back below the 5-year average. We’ve been talking about how work from home/ blended schedules was going to become the normal. I received a ton of pushback telling me that I was “missing the forest for the trees” or “didn’t understand demand. I think this “back to work” meter of core metro areas is indicative of what I expected. “Kastle’s ‘back to work’ barometers for major metro areas have moved sideways for better part of past couple years … San Francisco (green) still on lower end while New York (white) on higher end.” Our view since the outset of COVID was that we would get back to about 55%-60%, but we wouldn’t see much past the 65% level. Our view was that this was going to change the gasoline demand landscape of the future, and we don’t see this adjusting any higher.
Crude exports will be back on the rise as we see way more headwinds across the refined product world. Additional Russian volumes and unseasonable low demand will keep U.S. products stuck on the coast.

We’ve already seen a sizeable jump in gasoline stocks, but we expect to see a quick recovery of distillate storage as demand slows.
On a global basis, the refined products market is struggling as the crude market looks a bit better. Refiners have started some economic run cuts by “pulling forward” maintenance. This will help balance out the crude markets a bit, and we should see some premiums edge lower on the crude front.
China and India will be key to watch in the near term, especially as China comes back from Lunar New Year holidays. China did some considerable buying in front of the holiday, and it will be interesting to see how demand shapes up. Margins have crept slightly higher, but they still remain depressed- especially into the export market. This isn’t surprising given the run cuts, but the domestic market will be key over the next few weeks.

The Chinese government has been trying to consolidate the refining industry, and they remain on track to keep pushing teapots (Shandong refiners) to shutter or consolidate.
The Fed came out and paused their rate cuts, and I believe we are likely to see rate cuts remain on the backburner. It’s really hard to keep cutting rates as inflation shifts higher, and employment is a non-event when you look at general historics. The biggest battle the Fed is far from winning is inflation, and the insane amount of liquidity swirling the globe.
The easiest place to start is the food conundrum- especially as egg prices explode once again. The bird flu has created a need to cull 100’s of thousands with likely more to follow. But, the inflation issues are creeping higher and well past what would be deemed- “poor” or “lower middle class.” “Food banks across the nation are seeing a similar story: A post-pandemic wave of demand for food driven by working people caught in America’s cost-of-living crunch.”[1]
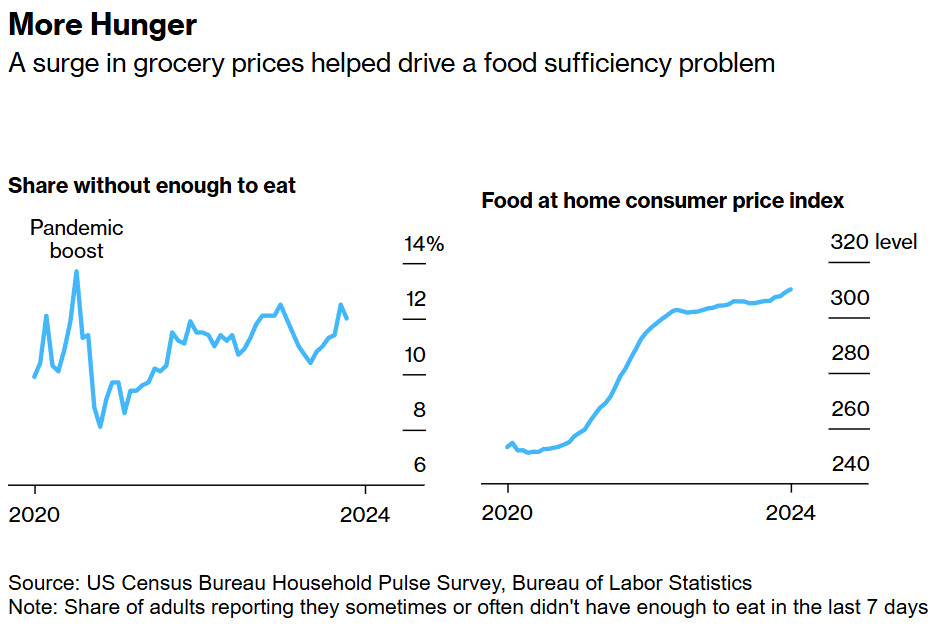
There is a new era of food insecurity, and it’s unlikely to improve given the limitations facing the rest of the market. This isn’t just a microcosm limited to just the U.S., but a global problem that hits all corners of the world. We need real solutions to bring down costs, and it comes down to providing farmers with alternatives on the ground. I think this quote carries the broad scope of the issue, and in 3+ years- nothing has improved.
“The Flagstaff Family Food Center in Arizona broke records in 2022 serving nearly 28,000 meals per month on average. At first it was exhilarating, said Ethan Amos, the food bank’s president. Then it was exhausting. “We expected things to slow down,” he said. It never did. The food bank is now serving more than 40,000 meals per month, using the same equipment and space it had in 2015 when it served 127,000 meals for the entire year. On the other side of the country, Capital Area Food Bank distributed 64 million meals last fiscal year in Washington and the neighboring areas — five million more than the prior year. Their research shows the sharpest increases in food insecurity in the area were in households earning about $100,000-$150,000.”
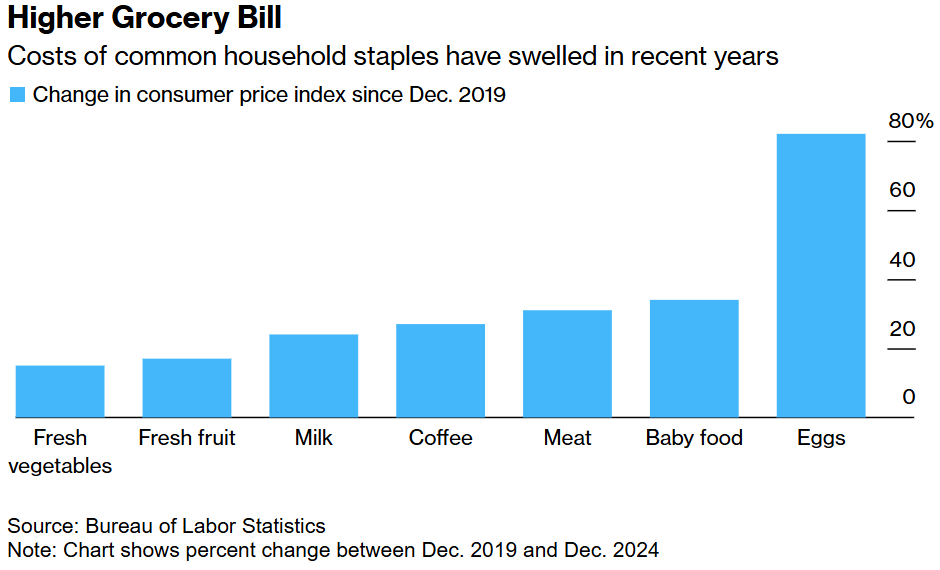
When we look at the last 5 years, grocery prices have risen by about 28%, and anyone who goes to the grocery store can attest to the fact that $100 barely covers a handful of items- let alone a cart full.
The issues are being felt broadly when we look at underlying credit cards and luxury spending. There are some brands that typically weather recessions because their main buyers represent a level of wealth that isn’t as impacted. We are seeing a bit more pressure this time around as spending stays under pressure.

- US household luxury spending fell 9% in 2024, marking the 2nd consecutive annual decline.
- This builds on the 12% drop recorded in 2023.
- Luxury spending has now declined for 10 straight quarters as consumer spending declines.
- US consumer spending currently reflects ~21% of global luxury sector’s revenue.
- As a result, luxury firms lost ~$55 billion of their market value in 2024, according to BofA. The luxury goods market is struggling.
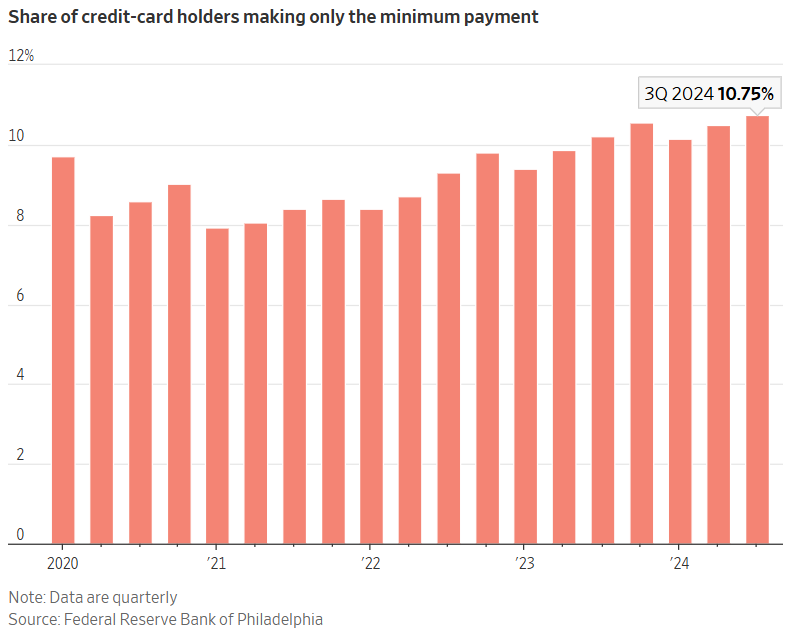
There are now a record number of people only paying the minimum payment on credit cards. “The share of US credit card holders making only the minimum payment rose to 10.75% last year, the highest level on record with data going back to 2012.” Interest rates are still shifting higher, which is putting more pressure on balance sheets. I expect the below number to only move in one direction as consumer pain surges.
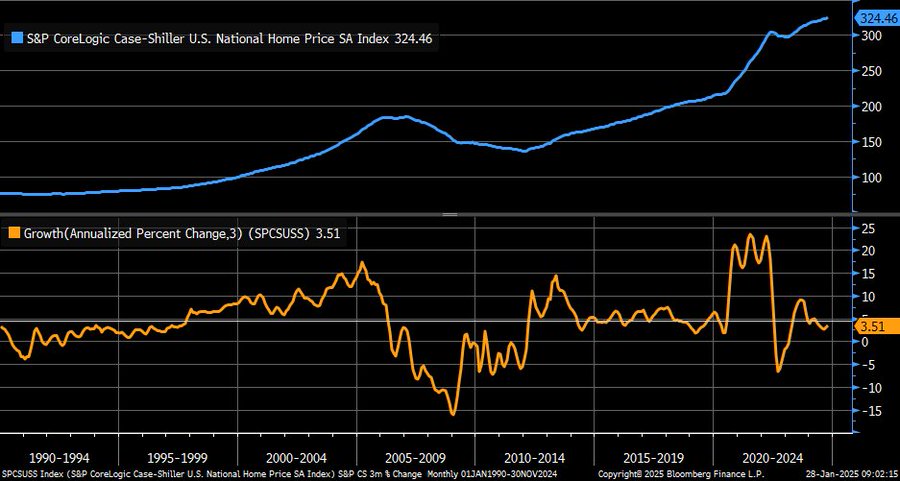
When we look at the broader market, it’s near impossible for most to afford homes as asset prices surge. “This is the gap btwn median household income and the income you need to afford a median price home, the latter being a full 50% larger than the former.”

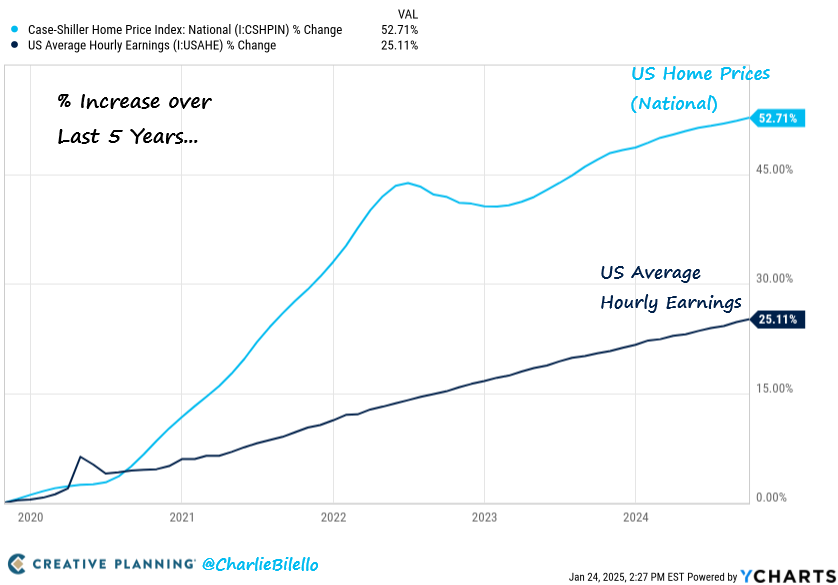
Here is another look at it- US Home Prices have increased 53% over the past five years, more than double the increase in US wages. This is the most unaffordable housing market in history.
When we look at food, home prices, and insurance, you can see that the affordability is dropping like a rock.
These are key aspects that were considered when the Fed paused rate cuts with some very important “pivots” in the commentary made by Powell.
- Fed leaves rates unchanged, pausing the “Fed Pivot”
- Decision to halt cuts was unanimous 12-0 vote
- Fed says inflation “remains somewhat elevated”
- Fed says “unemployment has stabilized at a low level”
- Statement on progress toward 2% inflation removed
- The Fed seems to be aware disinflation has stalled
The commentary also stripped out the commentary that inflation was working back to 2% and disinflation was happening. They are finally recognizing what I’ve been discussing for several quarters, as I highlighted the foolishness in trying to cut rates. Inflation was never on a downward trajectory, and all of the recent data has been supportive of stagflation.
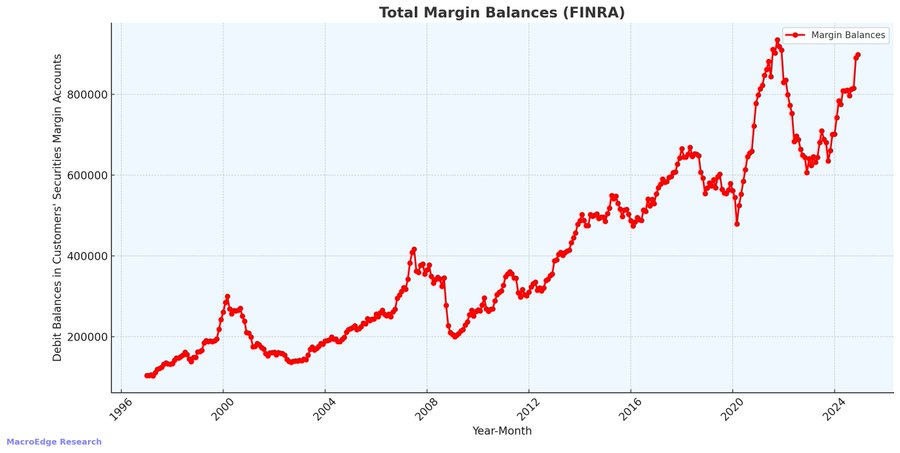
The market has been lulled to a sense of calm as money has piled into margin debt.
Another factor that the market was waiting for- PCE Price Index. There was some hope that it would come in softer, instead, it came in well above the prior number. It all points to a re-acceleration of inflation pressure across the board: “4Q2024 GDP Core PCE Price Index +2.5% vs. +2.5% est. & +2.2% prior.” No matter how you spin PCE- it shows an acceleration in inflation.

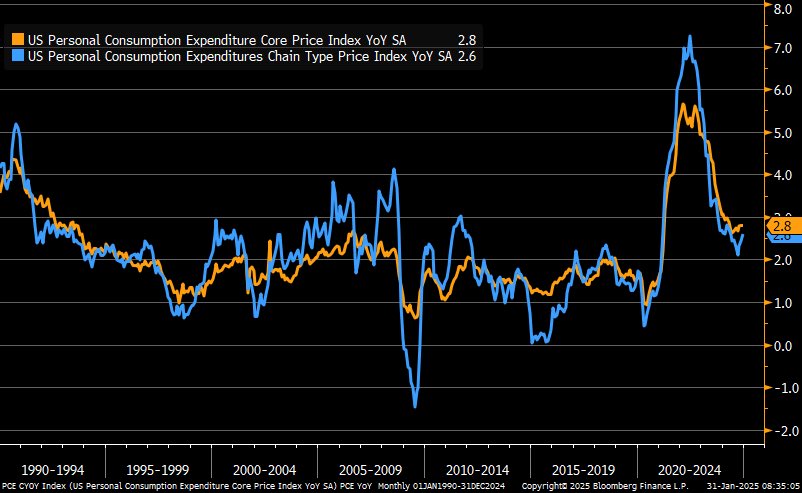
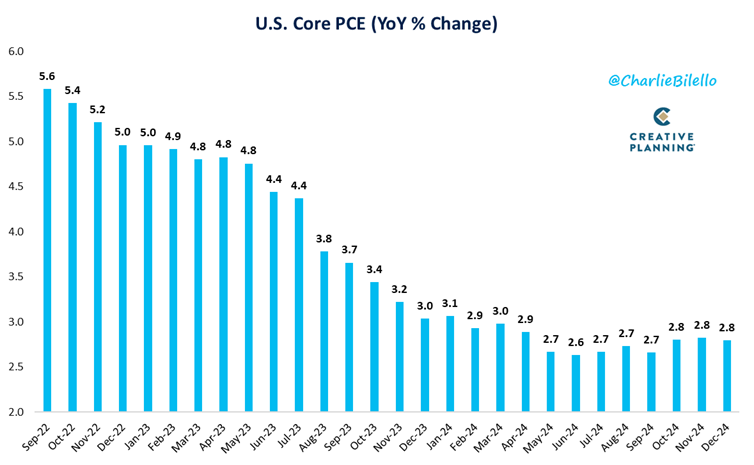
The leading indicators of the underlying regional Fed’s also support a higher shift in costs. This will keep pushing PCE higher: December PCE Price Index +2.6% y/y vs. +2.6% est. & +2.4% prior … core +2.8% vs. +2.8% est. & +2.8% prior
When we zoom in, you can see the pivot higher and as central banks cut rates and Fed pauses- there will be a ton of liquidity driving us back up.
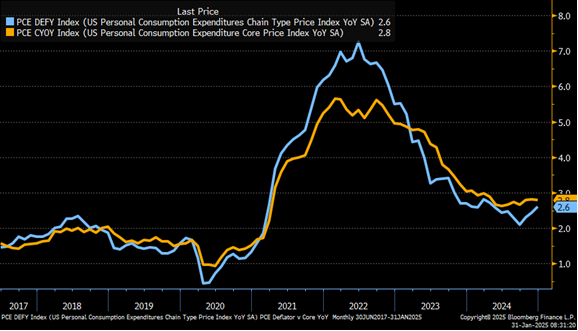
- December PCE inflation, the Fed’s preferred inflation measure, RISES to 2.6%, in-line with expectations of 2.6%.
- Core PCE inflation was 2.8%, in-line with expectations of 2.8%.
- PCE inflation is now at its highest level since May 2024.
In the late 70’s (1978), the Fed decided that the trajectory of inflation was falling “fast enough” and decided to cut rates. They made the same mistake last year and ignored all the signs showing it wasn’t adjusting, In a smart pivot, they paused their reductions and while they should increase rates- they will likely just pause at these levels. I will fight tooth and nail the view that our inflation is 2.8%- I would say it’s still much closer to 4% (at a minimum), but even using the Fed’s own metrics- there are significant problems ahead.
The U.S. consumer is still spending, which showed up in the regional Fed data. It shows that there is still an upward momentum in pricing, and the employment cost is going to enable or rather incentivize companies to keep trying to pass through cost: 4Q2024 Employment Cost Index +0.9% q/q vs. +0.9% est. & +0.8% prior … compensation +0.9% vs. +0.8% prior; wages & salaries +0.9% vs. +0.8% prior; benefits +0.8% vs. +0.8% prior

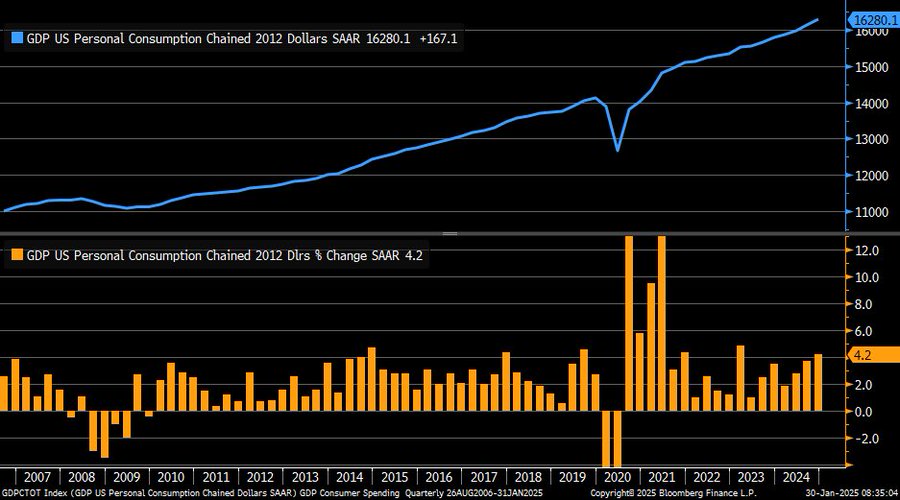
The below also shows the increases in personal consumption as the consumer maintains some strength supporting GDP. This is at the detriment of their balance sheet/ finances, but the U.S. consumer has always been known for their unpredictability: Real consumer spending on goods (blue) increased by 6.6% annualized in 4Q2024; real services spending (orange) increased by 3.1% … both were faster than in third quarter.

4Q2024 personal consumption +4.2% q/q ann. vs. +3.2% est. & +3.7% prior
The below regional Fed manufacturing data helps put into perspective the “Stagflation” readings coming across. There is middling growth, but the biggest driver for these have been “prices received” and “prices paid.” Adjusted for ISM methodology, regional manufacturing indexes are all over the place … Philly (blue) suggests an ISM reading of 61.4 for January, while Kansas City (purple) is on low end with 47.4

When you layer in current National Home Prices, you can see how difficult it is to believe that inflation is sitting at 2.8%. “Home price growth has moderated but remains healthy … as of November, 3-month annualized change in S&P CoreLogic CS National Home Price Index moved up to +3.5%” The biggest monthly costs for people are all well north of 3% and much closer to 7% in many cases… so how could we actually be at 2.8%? November S&P CoreLogic CS 20-City Home Price Index +4.33% y/y vs. +4.24% est. & +4.23% prior … National Home Price Index +3.75% y/y vs. +3.59% prior isn’t something that points to a deflationary or even disinflationary backdrop.
The market is steamrolling into another inflationary spiral, which is being sniffed out by bonds and gold. The liquidity push will be more than enough to offset any “deflation” that can be imported from China. I hope that Powell maintains the discipline to shrink the Fed balance sheet, because we are still FAR from what was deemed “normal” before COVID. The Fed’s balance sheet is now at its lowest level since May 2020, down over $2.1 trillion from its peak in April 2022.
- How much more QT is needed to unwind all of the QE from March 2020 – April 2022? $2.7 trillion.

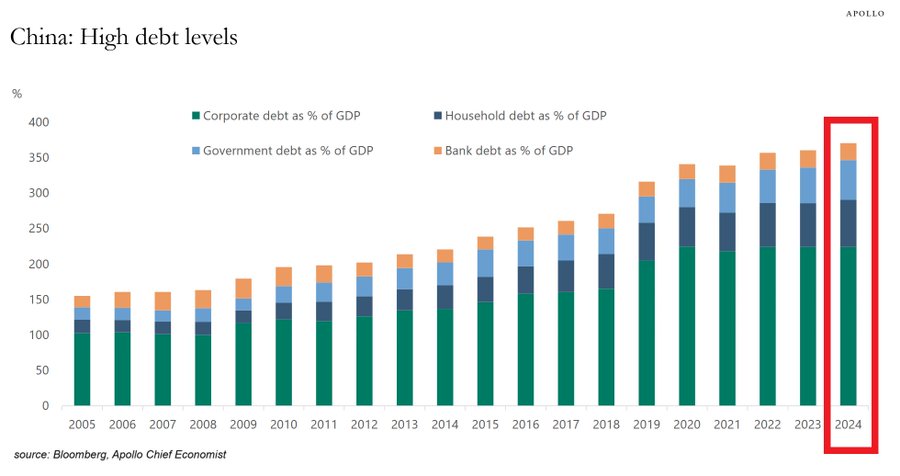
The Chinese economy continues to flounder under the weight of broad debt in the country and persistent weakness in real estate.
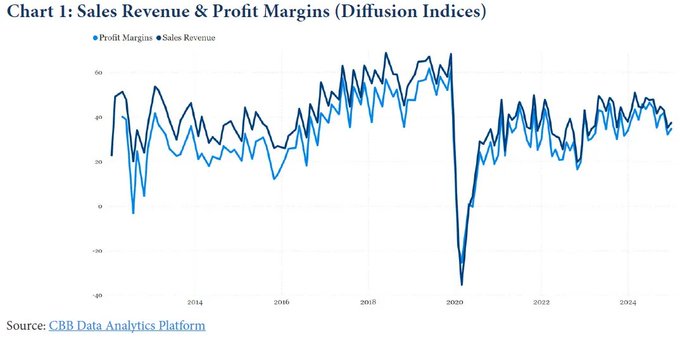
China posted muted numbers across the board: “China Beige Book– publishes its latest survey today and finds a situation that is thoroughly unexciting, but with no imminent risk of a crisis. The consumer, as measured by sales revenues and profit margins, is in better shape than for much of the post-pandemic period…”
The demand for debt still remains at record low, and it’s due to the overleveraged nature of the corporate and retail consumer. State owned entities are still the only main borrowers, and given the leverage situation and weak cash flow- we don’t see that changing any time soon.
I think some of these statistics will put this into perspective:
- China’s total debt to GDP rose to a RECORD of ~370%.
- The share has DOUBLED over the last 14 years.
- This does not include shadow banking (outside traditional banking sector).
- China has a massive debt problem and it will not go away soon.
As the data comes out for the Lunar New year, we will provide color behind how the data is shaping up for Q1 and broadly throughout 2025.


