The term “Tier 1 acreage” has long served as shorthand for the most productive rock in U.S. shale — often defined by early-time performance metrics such as IP30, IP90, lateral length, and completion intensity. These metrics have played a central role in identifying high-quality zones and continue to offer valuable insight. However, as shale basins mature and remaining undrilled inventory declines, it is increasingly clear that short-term productivity alone cannot fully explain long-term asset value. The industry’s definition of Tier 1 must now expand to reflect a more complete picture — one that integrates operational efficiency, economic resilience, and the ability to sustain performance over time.
A Tier 1 label today often hinges on geological quality and early-time output, reinforced by characteristics such as lateral length, proppant intensity, and initial flow rates. These indicators remain important, but they present an incomplete picture. High IP wells can underperform on a full-cycle basis if they carry higher decline rates, higher costs, or limited optionality for recompletions. Moreover, this lens overlooks key factors shaping today’s development priorities: existing infrastructure, refrac potential, and access to efficient supply chains.
Recent analysis underscores the need to rethink the distinction between Tier 1 and Tier 2 acreage. It turns out that the performance gap between the two categories is often smaller than expected. In many cases, “Tier 2” wells deliver comparable results to Tier 1, particularly when completions are optimized. This is partly due to the diminishing returns observed in overdeveloped Tier 1 zones, where parent-child interference and spacing degradation have eroded productivity. Meanwhile, less-drilled areas previously labeled Tier 2 may outperform simply because they benefit from better spacing and less reservoir pressure depletion. This suggests that static Tier maps are losing relevance and that acreage classification must become more dynamic, performance-based, and operationally aware.

Source: Deloitte
Refracs to the rescue
As activity shifts into more marginal areas and the inventory of undrilled high-performing rock shrinks, operators are increasingly revisiting earlier wells and leveraging infrastructure investments to extend field life. In this environment, refracs deserve renewed attention. While previously viewed as a secondary strategy, refracs now present a viable, and in many cases preferable, method of extracting value from already-de-risked rock. With improved targeting and completions technologies, refracs offer lower risk profiles, better capital efficiency, and faster payout timelines compared to many new drills.
Recent field results underscore the economic rationale behind refracs. In plays like the Eagle Ford, Bakken, and parts of the Permian, modern refracs are delivering production uplifts of 70% to over 100% compared to initial completions. According to S&P Global, refracs in the Eagle Ford now outperform new drills in terms of capital efficiency, often delivering better payout timelines with 25% of the capital spend. BP’s refrac program in the Eagle Ford, for example, has become one of its most productive initiatives, tapping into previously uneconomic reserves using refined pressure diagnostics and targeted stimulation.

Tier 1, therefore, should no longer be viewed only through the lens of geology. A more comprehensive and practical framework incorporates five key pillars: rock quality, economic performance, operational efficiency, refrac potential, and strategic/environmental stability. This multidimensional view is supported by technical literature and industry analysis — from USGS resource assessments to McKinsey energy transition risk studies — all of which point to the need for broader, more adaptable evaluation criteria.
There are further examples that reinforces the above point: BPX operates across the Eagle Ford’s oil and gas windows, with significant activity in Karnes, La Salle, Live Oak, McMullen, and Zavala counties. These are mature areas with a high concentration of legacy wells—many of which were originally completed before 2016, making them ideal candidates for modern refrac techniques like linear isolation refracs. By installing new liners and treating these wells as near-new projects, BPX and other operators like Verdun Oil and ConocoPhillips are breathing new life into old infrastructure.
These developments are echoed in the “Running Refracs Count” from Primary Vision, which shows consistent weekly refrac activity across U.S. shale basins. While the data fluctuates, its regularity underscores a critical shift: refracs are not rare or experimental—they are becoming a structural part of shale operations. This trend is gaining momentum not just because of technical innovation, but also because the economics make sense.
Beyond Geology: Embracing Capital Efficiency Metrics in Shale Evaluation
Another important element that relates to refracs is the acknowledgment of the fact that industry’s focus has shifted towards capital efficiency metrics to assess asset performance more holistically. According to the U.S. Energy Information Administration (EIA), in the first eight months of 2024, upstream capital expenditure per barrel of oil equivalent (BOE) produced by 34 publicly traded U.S. oil companies averaged around $21/BOE in real terms, a significant reduction from $32/BOE in 2019. This improvement in capital efficiency underscores the industry’s ability to enhance production while controlling costs.

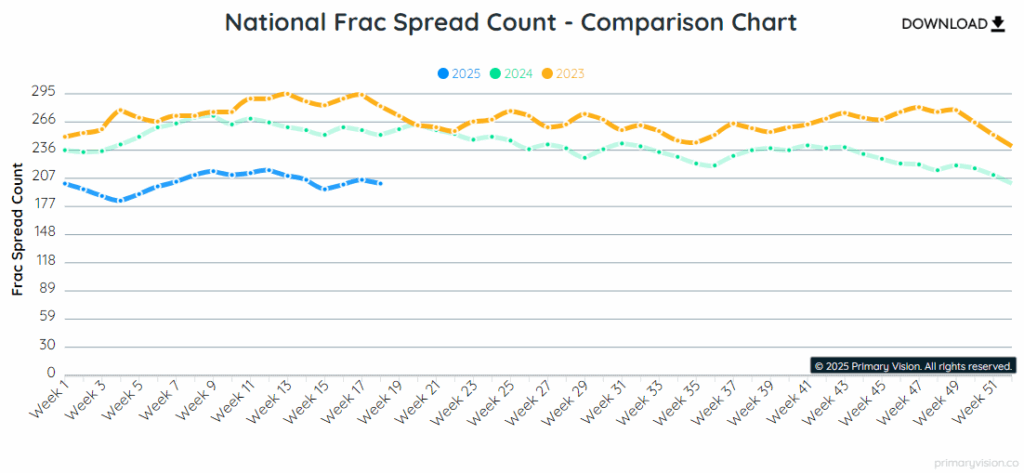
Furthermore, the industry’s reinvestment rate—a measure of capital expenditure relative to cash flow from operations—has stabilized, reflecting a disciplined approach to capital allocation. In the second quarter of 2023, the reinvestment rate among a peer group of 18 public shale companies reached 72%, the highest in three years, indicating a balanced strategy between reinvestment and shareholder returns. When you look at our Frac Operator Monitor it also shows that companies plan to add more Frac Spreads moving forward while the Frac Job Count has been holding steady.

Other financial metrics, including return on capital employed (ROCE) and internal rate of return (IRR), provide a more nuanced understanding of asset performance, enabling operators to identify high-performing assets that may not reside within traditionally defined Tier 1 geological zones.
The goal should not be to replace geological assessments, but to supplement them with a more complete understanding of value creation across the life of the asset. In doing so, the industry can better align technical, financial, and strategic goals — ensuring that Tier 1 is not just about where to drill next, but how to extract the most value over time.


