Primary Vision
  • HOME
  • ABOUT US
    • ABOUT US
    • PRIMARY VISION AI INNOVATIONS
  • EFRACS
  • EVENTS
  • PRESS
  • SUPPORT
  • FAQ
  • LATEST NEWS
  • LOGIN
  • HOME
  • ABOUT US
    • ABOUT US
    • PRIMARY VISION AI INNOVATIONS
  • EFRACS
  • EVENTS
  • PRESS
  • SUPPORT
  • FAQ
  • LATEST NEWS
  • LOGIN
No Result
View All Result
Primary Vision
Home Market Trends

Schlumberger Part 2: Estimates And Relative Valuation

Avik Chowdhury by Avik Chowdhury
May 3, 2022
in Market Trends
0
Schlumberger Part 2: Estimates And Relative Valuation

  • Schlumberger’s revenue estimate is upward trending in the next couple of years but may slow down after that
  • EBITDA is also to remain steady in the next couple of years
  • The stock is relatively overvalued at the current level

Part 1 of this article discussed Schlumberger’s (SLB) outlook, performance, and financial condition. In this part, we will discuss more.

Linear Regression Based Forecast

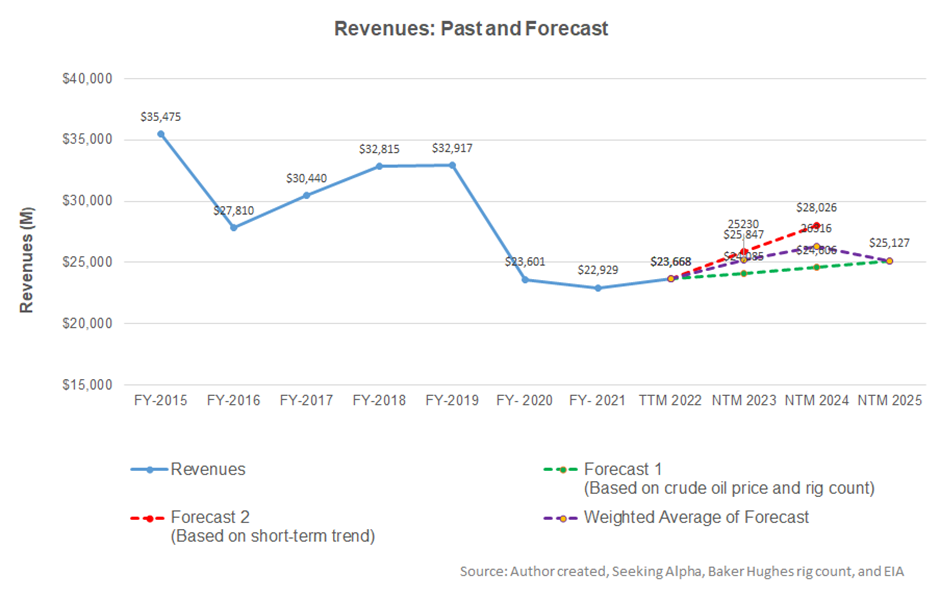
A regression equation-based model on the relationship among the crude oil price, global rig count, and SLB’s reported revenues for the past six years and the previous eight-quarters suggests revenues to increase in the next two years. However, revenues can decline in NTM (next 12-months) 2023.

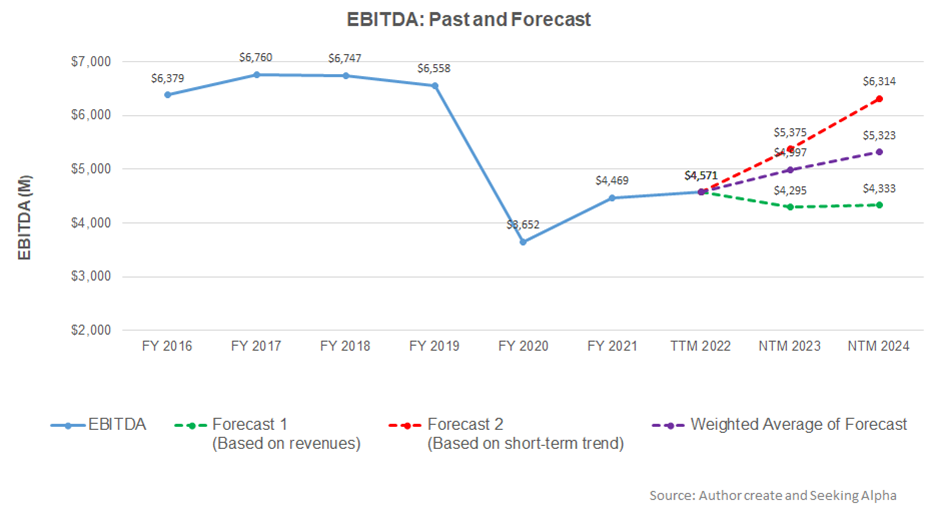
Based on the average forecast revenues, the model suggests the company’s EBITDA will increase in the next two years. In NTM 2025, however. the EBITDA can decline sharply.

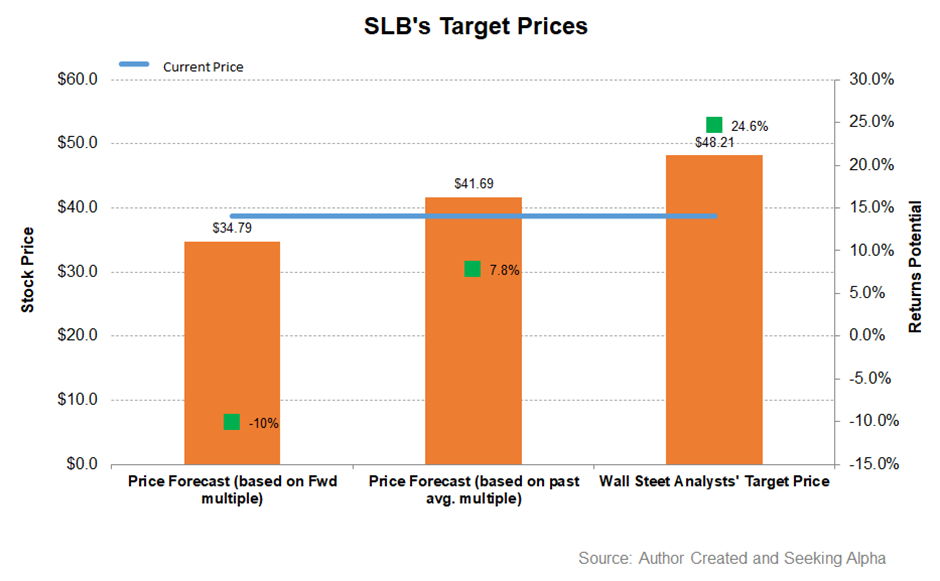
Returns potential using SLB’s forward EV/EBITDA multiple (11.9x) is lower (10% downside) than the returns potential using the past average multiple (8% upside). The Wall Street analysts have slightly higher return expectations (24% upside).

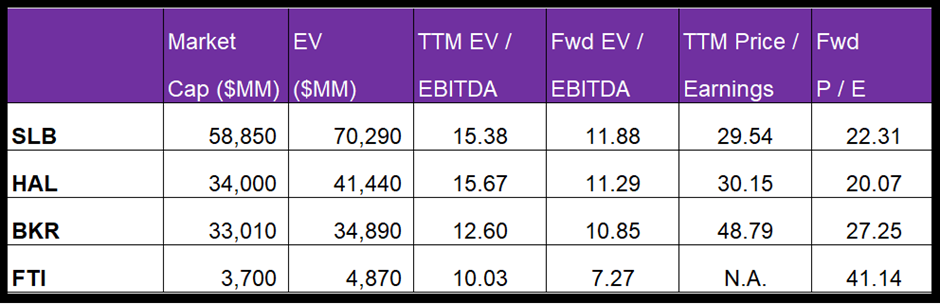
SLB’s forward EV-to-EBITDA multiple contraction versus the adjusted trailing 12-month EV/EBITDA is in line with the peers because the company’s EBITDA is expected to increase nearly as much as its peers in the next four quarters. This would typically reflect a similar EV/EBITDA multiple compared to the peers. The company’s EV/EBITDA multiple is higher than the peers’ (HAL, BKR, and FTI) average of 12.8x. So, I think the stock is overvalued at the current price.

What’s The Take On SLB?

Schlumberger’s management is relying on a multi-year upcycle. While the North American shale story firms up, it expects activities in the Middle East and international offshore activities to recover significantly in the medium term. Also, for the long term, it continues to deal with technological improvement (DELFI customers and the DELFI cloud platform) and investment in clean energy, consisting of low-carbon or carbon-neutral energy technologies. Its revenue growth in FY2022 can reach “mid-single-digits” and the operating margin expansion by 50 to 100 basis points in Q2 2022.

However, the global supply pressure, logistic constraints, and the Ukraine war will disrupt the energy sector’s growth path. SLB’s free cash flows deteriorated significantly in Q1. Because it pursues a low capital-intensive strategy, the low capital investment-to-revenue ratio will help improve cash flows by the end of the year. At the current level, the stock is overvalued compared to its peers. It can move sideways in the short term. Nonetheless, SLB’s balance sheet strength and strategic changes will power it forward over a more extended period.

Previous Post

Gas cut off, Growth in EU, Slowdown in China and other things

Next Post

Year-Over-Year Oil Data (USA):

Related Posts

STEP Energy Services: Q2 TAKE THREE
Market Trends

STEP Energy Services: Q2 TAKE THREE

August 8, 2025
ProFrac Holding: Q2 TAKE THREE
Market Trends

ProFrac Holding: Q2 TAKE THREE

August 7, 2025
KLX Energy Services: Q2 TAKE THREE
Market Trends

KLX Energy Services: Q2 TAKE THREE

August 7, 2025
Nine Energy Service: Q2 TAKE THREE
Market Trends

Nine Energy Service: Q2 TAKE THREE

August 6, 2025
Monday Macro View: Will we see a frac’ing boom in Mexico?
Market Trends

Monday Macro View: Will we see a frac’ing boom in Mexico?

August 5, 2025
ProPetro Holding: Q2 TAKE THREE
Market Trends

ProPetro Holding: Q2 TAKE THREE

July 30, 2025
Next Post
Year-Over-Year Oil Data (USA):

Year-Over-Year Oil Data (USA):

Please login to join discussion

Recent News

What is common between U.S. economy and global oil markets?

What is common between U.S. economy and global oil markets?

September 9, 2025
STEP Energy Services: Q2 TAKE THREE

STEP Energy Services: Q2 TAKE THREE

August 8, 2025
ProFrac Holding: Q2 TAKE THREE

ProFrac Holding: Q2 TAKE THREE

August 7, 2025
KLX Energy Services: Q2 TAKE THREE

KLX Energy Services: Q2 TAKE THREE

August 7, 2025
Nine Energy Service: Q2 TAKE THREE

Nine Energy Service: Q2 TAKE THREE

August 6, 2025
Primary Vision

Established in 2011, we are renowned for our expert frac data and analytics, providing a rich array of unique indicators and industry commentary.

CONTACT

+1-713-554-4977
info@primaryvision.co

SOCIAL NETWORKS

POLICIES

Privacy Policy
Terms of Use

PARTNERS

Amazon Web Services

TRUSTED SITES

Logo

Logo

RECENT NEWS

What is common between U.S. economy and global oil markets?

What is common between U.S. economy and global oil markets?

September 9, 2025
STEP Energy Services: Q2 TAKE THREE

STEP Energy Services: Q2 TAKE THREE

August 8, 2025
ProFrac Holding: Q2 TAKE THREE

ProFrac Holding: Q2 TAKE THREE

August 7, 2025
KLX Energy Services: Q2 TAKE THREE

KLX Energy Services: Q2 TAKE THREE

August 7, 2025
Nine Energy Service: Q2 TAKE THREE

Nine Energy Service: Q2 TAKE THREE

August 6, 2025
  • HOME
  • ABOUT US
  • EFRACS
  • EVENTS
  • PRESS
  • SUPPORT
  • FAQ
  • LATEST NEWS
  • LOGIN

© 2025 Primary Vision. All rights reserved.

  • HOME
  • ABOUT US
    • ABOUT US
    • PRIMARY VISION AI INNOVATIONS
  • EFRACS
  • EVENTS
  • PRESS
  • SUPPORT
  • FAQ
  • LATEST NEWS
  • LOGIN

© 2025 Primary Vision. All rights reserved.