In our last post, we discussed a variety of factors that have influenced frac activity levels in the Marcellus shale, including continually rising natural gas production levels, basis differentials at regional market hubs relative to Henry Hub natural gas spot prices, and pipeline takeaway constraints. Reduced drilling and completion (D&C) activity by certain operators has been offset by increased activity by others. That said, there is little doubt that D&C activity would be more robust were it not for these factors. We also took a look at some notable acquisitions and divestments in the Appalachian Basin, the most notable of which was Southwestern Energy’s acquisition from Chesapeake Energy of 413,000 net acres and 435 wells with net production in September 2014 of 336 MMcfe.
Today, we delve into well completion designs that have been used in efforts to optimize well performance and what implications it has had for proppant use. In particular, we focus on 16 leading E&Ps active in the Marcellus.
With E&Ps in full-scale well manufacturing mode in the Marcellus, emphasis has shifted to increased operational efficiency to bring down or, at the very least, contain well construction costs. But just as we see across several oily basins, operators targeting both liquids-rich and dry-gas zones of the Marcellus (and Utica) shale have continued to fine-tune well and frac designs to optimize well performance.
In an effort to increase EURs and produce wells to their maximum potential, E&Ps in the Marcellus have been: 1) drilling increasingly longer laterals; 2) improving lateral placement in the reservoir; 3) increasing frac stage counts per well; 4) using shorter stage lengths (SSL) and reduced cluster spacing (RCS) completions (tighter spacing between stages and more perforations or “perfs” per lateral). RCS completions were first adopted in the Marcellus, and operators have been using the technique since early-2012. As Credit Suisse has suggested, RCS completions have become “almost universally adopted in the Marcellus.” Operators are more commonly evaluating well costs and economics based on per-lateral-foot basis.
In April 2012, Range Resources announced that 2 wells using RCS completions produced at twice the initial production rate (IP-rate) as compared to non-RCS wells on the same well pad. In September 2013, Antero Resources commented that using RCS frac designs in 17 liquids-rich Marcellus wells resulted in incremental frac costs that averaged 20% higher than previous designs ($2 million vs. $1.5 million per well). But the operator saw IP-rates increase by 25-35% compared to similar wells in the area. CONSOL Energy commented that when it first used RCS on two wells in early-2012, IP-rate improvements over non-RCS wells were not meaningful. However, the operator observed that after 15 months of production history, these two wells were 20% and 40% above the type curve, respectively.
What is the implication of all of this for proppant? Longer laterals, SSL/RCS completions, and increased stage counts per well all in isolation lead to increased proppant. But the contemporaneous adoption of all of these practices has led to significant increases in average proppant mass pumper per well.
We categorized 16 publicly-traded operators into peer groups as outlined in the table below. The E&Ps have collectively accounted for approximately 75% of frac activity in the Marcellus since 2012.

Notes: XTO Energy operates autonomously as a subsidiary of ExxonMobil and manages US Land upstream operations on behalf of its parent company; E&P categorization reflects that of Raymond James
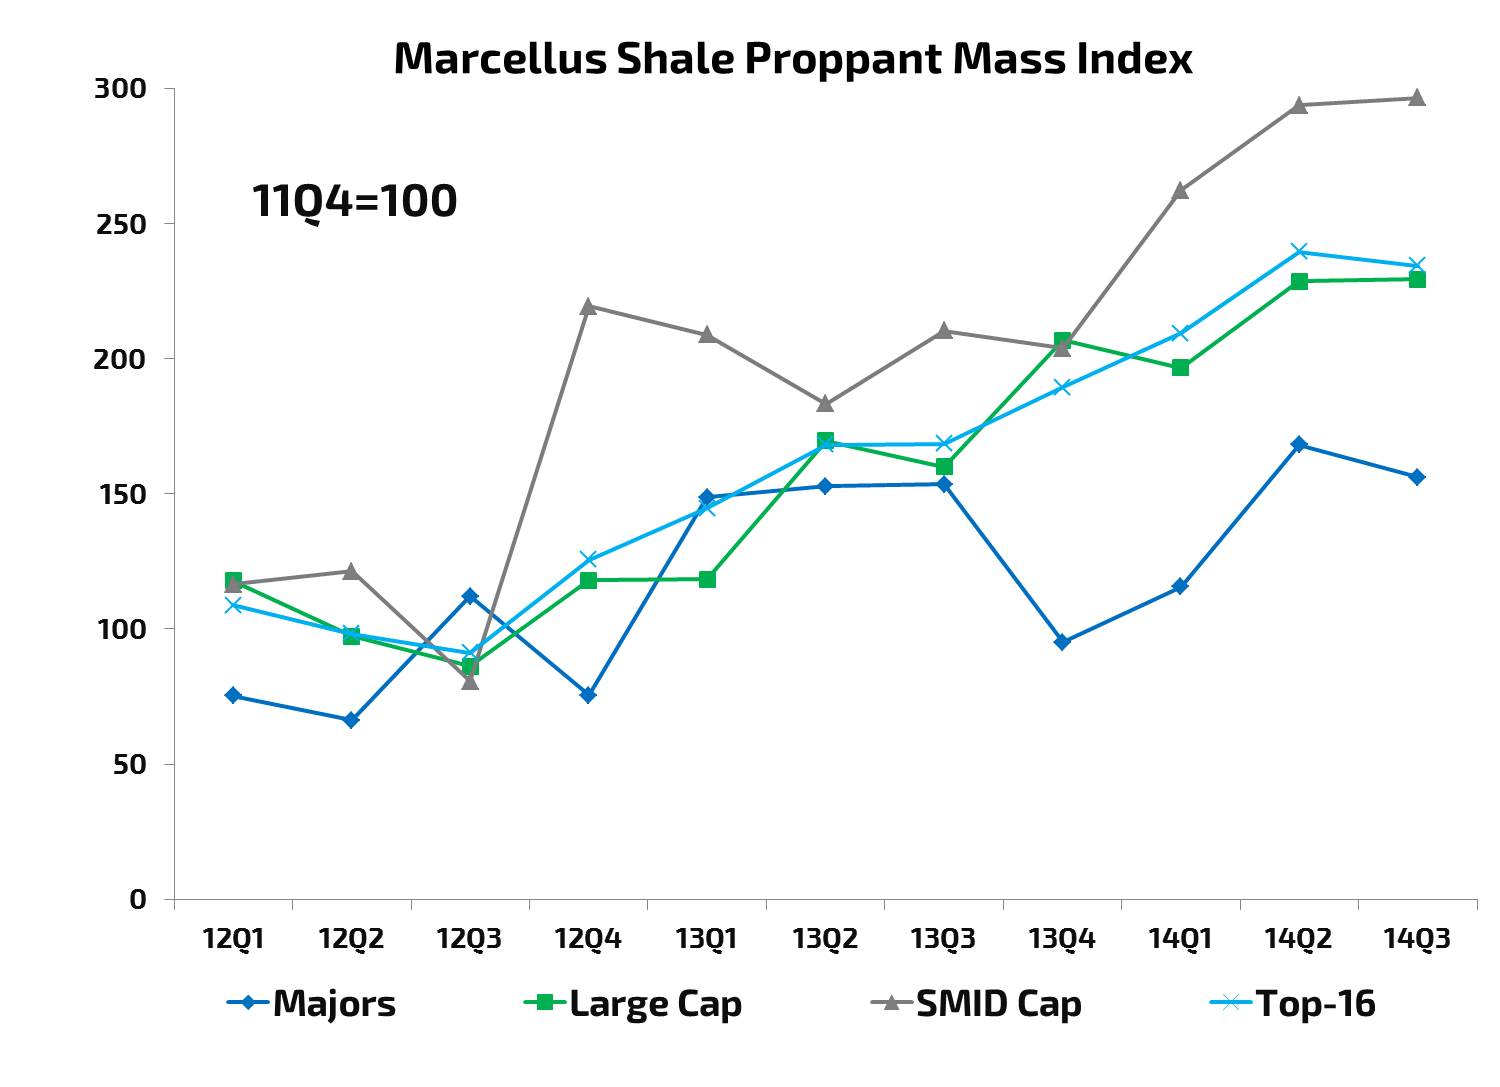
The proppant mass index presented below uses weighted averages based on the number of wells frac’ed by operators within each peer group. The chart reflects growth of average proppant mass per well using 2011 Q4 as a base of comparison.

Sources: Primary Vision
The findings are rather staggering. As a collective, average total proppant mass per well is up 2.3x between 2011 Q4 and 2014 Q3. Our analytics reveal that as a collective group, average proppant mass per well has increased at a 32% CAGR between 2012 and 2014.
As this trend has played out, it has had cascading impacts across the upstream supply chain. After a surge of manufacturing capacity expansion during 2012 and 2013 led to an oversupply and falling pricing, frac sand suppliers have seen significant demand growth bring the market back closer to balance over the past ~12 months and have realized . Proppant logistics have been challenging due to chronic shortages of rail cars and truck-trailers as well as intermittently by weather. During 2014, operators have reported delays scheduling frac due to temporary sand shortages. Certain frac services providers have commented that proppant hauling costs essentially doubled overnight during spring 2014 – sand haulers appeared to be colluding by simultaneously charging a per-truck day rate rather than on a per-load basis. Some frac services providers have rushed to lock in long-term supply agreements with sand suppliers.
Primary Vision’s customers leverage our Big Data solutions to gain meaningful insights on the latest market dynamics and act accordingly. By staying ahead of the curve, they can make data-driven tactical and strategic decisions that help increase their bottom line.


