- U.S. Well Services’ exit fleet size in March 2022 was larger than the Q1-average and was expected to move higher in April
- It has lined up four new build Nyx Clean Fleets through Q4
- Electric fleets offer premium pricing and lower repair and maintenance costs on a per pump hour basis compared to their diesel counterparts
- However, the financial risks remain high due to negative shareholders’ equity and negative cash flows
Electric Pumps And Cost Inflation
In late-2021, USWS exited the conventional pressure pumping business and now concentrates entirely on electric pumps. Currently, all its fleet are electric pressure pumps. Because the fuel costs for conventional diesel fleet rose in the current environment, it made even more sense for the company to keep transitioning to the electric pumping fleets. By its estimates, the fuel savings from replacing the diesel fleet increased from $1 million-$1.5 million per month to $2.5 million per month. The electric fleets offer premium pricing due to higher barriers to entry and lower maintenance costs due to their extended life. Since USWS started using all-electric fleets, its repair and maintenance costs on a per pump hour basis decreased by 40% compared to the 2019-level.
Although leading-edge pricing has recovered sharply over the past few quarters, the pressure pumpers have been hit hard by the cost of inflation, labor scarcity, and logistical bottlenecks. USWS, which has invested generously in the Clean Fleet technology, faced difficulty in absorbing these costs with a lower active fleet count. However, the situation is about to change as industry activity picks up.
The Q2 Outlook
USWS averaged 4.7 active fleets in Q1 but exited Q1 the quarter with six active fleets. It expects to average six to seven active fleets in Q2. It plans to deploy the first new-build Nyx Clean Fleet in Q2, followed by another in early Q3, and two more in early Q4. Through longer contracts, it has also been trying to lock in pricing to offset the impact of cost inflation. We do not see price improving shortly, but in the medium-to-long term, lower costs and improved pricing will reflect inflated operating margins.
Investors should note that USWS’s transformation strategy into a full-electric pump fleet received a shot in the arms in 2021. In May, USWS and KCF Technologies announced integration between electric frac pump control systems for fully automated pump controls. In March, it finalized a contract to provide electric pressure pumping services. Under this, USWS will dedicate a new build Nyx Clean Fleet in Texas. In 2021, the company signed a license agreement with ProFrac (PUMP). In February 2022, it signed a contract to provide electric pressure pumping services (Nyx Clean Fleet) for XCL Resources (XCL).
In December 2021, it signed another contract with Callon Petroleum (CPE). The contract runs for three years. It exited Q1 2022 with five of its six active frac fleets belonging to Clean Fleets. Geographically, four fleets were working in the Appalachian Basin, one in the Permian Basin, and one in the Rockies.
As the length of contracts extended, the annualized March 2022 exit rate increased to $41 million of revenue per fleet, and the gross profit contribution per fleet was $10 million. April was expected to outperform March. As the fracking equipment demand and supply position becomes tighter, USWS should see its profitability improve in Q2.
The Q1 2022 Drivers

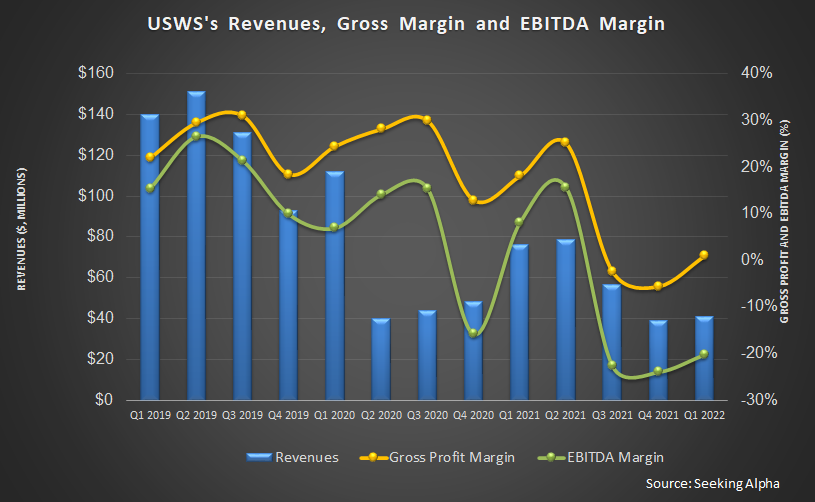
During Q1, the company’s revenues increased by 6% compared to Q4 2021, despite the loss of revenue following its exit from the conventional pressure pumping market in mid-2021. Its fleet utilization was 94% in Q1, which equated to 4.4 fully utilized fleets. Also, service and equipment revenue went up by 17% quarter-over-quarter. Higher active fleet count and contracting fleets at favorable pricing to its customers led to the topline increase. The Q1 revenues from sand, chemicals, and trucking declined 45% sequentially because the company did not provide sand for any of its customers.
The company’s earnings loss remained nearly unchanged (at -$0.45) in Q1 compared to a quarter ago. The EBITDA margin recovered slightly but remained well below the positive territory. SG&A cost increased by 32% in the past quarter due to increased personnel costs and professional fees.
Cash Flow Is Negative, And Risks Exist
As of March 31, 2022, USWS’s liquidity (cash and including revolving credit facility) was $49.6 million. Although the company’s total debt was relatively high ($269 million) as of that date, 41% of this is convertible debt, which, if converted, can reduce the debt load significantly. Earlier, the company disclosed that if it can lower the debt level further to $103 million by Q1 2022, the interest rate on loan can fall to 1% in 2022.
USWS’s cash flow from operations (or CFO) was negative in Q1 2022 but still an improvement compared to a year ago. The negative CFO resulted primarily from the additional costs related to the redeployment of pressure pumping fleets. As a result, free cash flow also turned negative. The company has also accumulated a deficit, incurring net losses for the past few years.
Learn about USWS’s revenue and EBITDA estimates, relative valuation, and target price in Part 2 of the article.


