Primary Vision
  • HOME
  • ABOUT US
    • ABOUT US
    • PRIMARY VISION AI INNOVATIONS
  • RESEARCH
    • INSIGHTS & ARTICLES
    • FREE ARTICLES
  • EVENTS
  • PRESS
  • SUPPORT
  • FAQ
  • LATEST NEWS
  • LOGIN
  • SIGN UP!
    • FRAC SPREAD COUNT SIGN-UP!
    • ENTERPRISE SUBSCRIPTION PLAN SIGN UP!
  • HOME
  • ABOUT US
    • ABOUT US
    • PRIMARY VISION AI INNOVATIONS
  • RESEARCH
    • INSIGHTS & ARTICLES
    • FREE ARTICLES
  • EVENTS
  • PRESS
  • SUPPORT
  • FAQ
  • LATEST NEWS
  • LOGIN
  • SIGN UP!
    • FRAC SPREAD COUNT SIGN-UP!
    • ENTERPRISE SUBSCRIPTION PLAN SIGN UP!
No Result
View All Result
Primary Vision
Home Market Trends

Baker Hughes Part 2: Estimates And Relative Valuation

Avik Chowdhury by Avik Chowdhury
October 21, 2022
in Market Trends
0
Baker Hughes Part 2: Estimates And Relative Valuation

  • Our regression model suggests a steadily increasing revenue trend in the next three years.
  • EBITDA can decline in NTM 2023 but can improve in NTM 2024.
  • The stock is reasonably valued at the current level.

Part 1 of this article discussed Baker Hughes’s (BKR) outlook, performance, and financial condition. In this part, we will discuss more.

Linear Regression Based Forecast

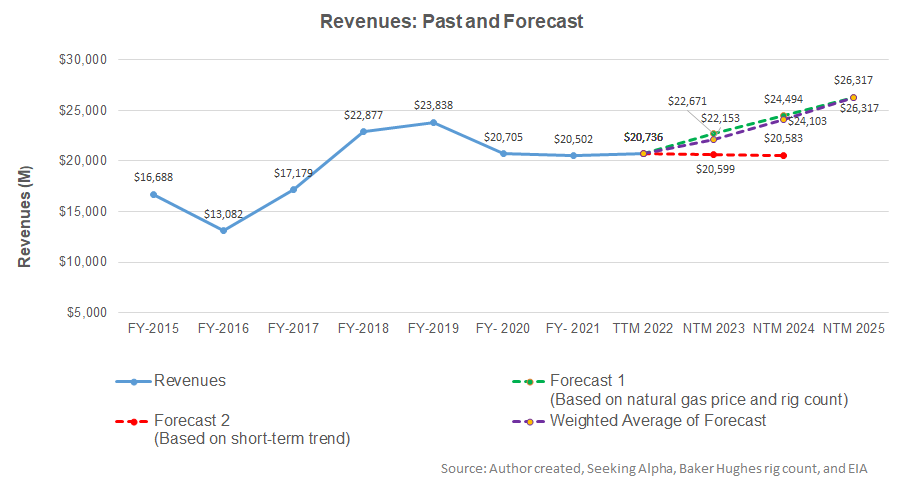
Based on a regression equation among the natural gas price, global rig count, and BKR’s reported revenues for the past seven years and the previous eight-quarters, revenues will increase by 7% in the next 12 months (or NTM 2023) and further by 8.8% in NTM 2024, before reaching a 9% growth rate in NTM 2025.

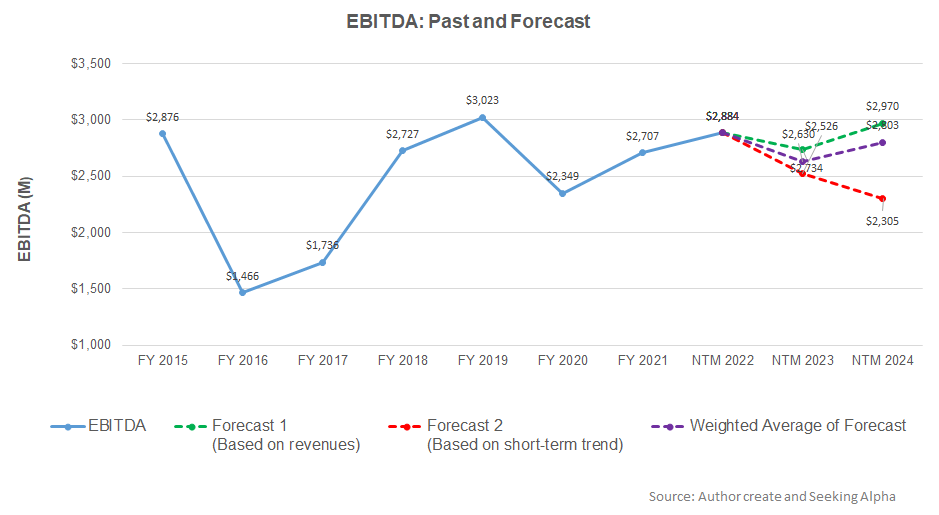
Based on the regression model using the average forecast revenues, the company’s EBITDA is expected to decrease by 9% in NTM 2023. However, in NTM 2024, it can increase by 7%.

Target Price And Relative Valuation

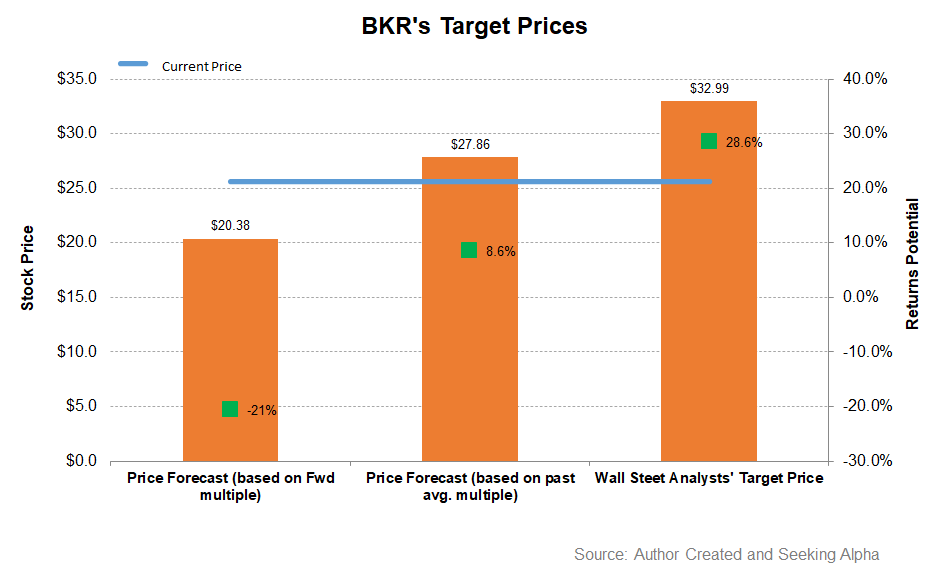
Returns potential using BKR’s forward EV/EBITDA multiple (9.3x) is lower (21% downside) compared to returns potential using the past average multiple (9% upside). The Wall Street analysts have higher return expectations (29% upside).

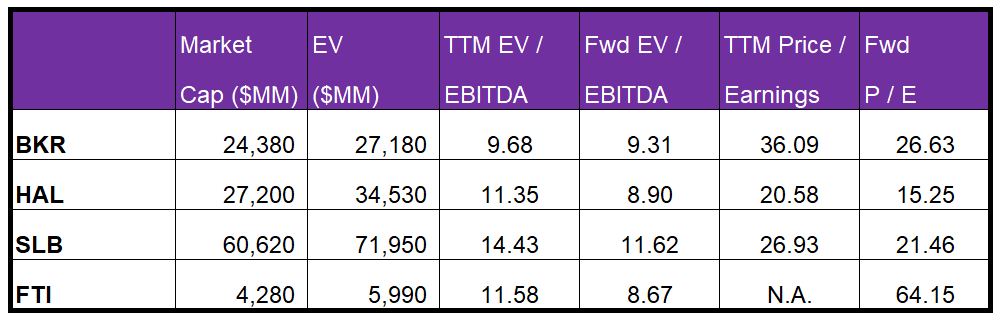
Baker Hughes is currently trading at an EV-to-adjusted EBITDA multiple of 9.7x. Based on sell-side analysts’ EBITDA estimates, the forward EV/EBITDA multiple is 9.3x. The current multiple is lower than the past five-year average EV/EBITDA multiple of 11.8x.

BKR’s forward EV-to-EBITDA multiple contraction versus the current EV/EBITDA is less steep than peers because the company’s EBITDA is expected to increase less sharply in the next four quarters. This would typically result in a lower EV/EBITDA multiple than peers. The stock’s EV/EBITDA multiple is lower than its peers’ (HAL, SLB, and FTI) average. So, the stock is reasonably valued versus its peers.

Analyst Rating

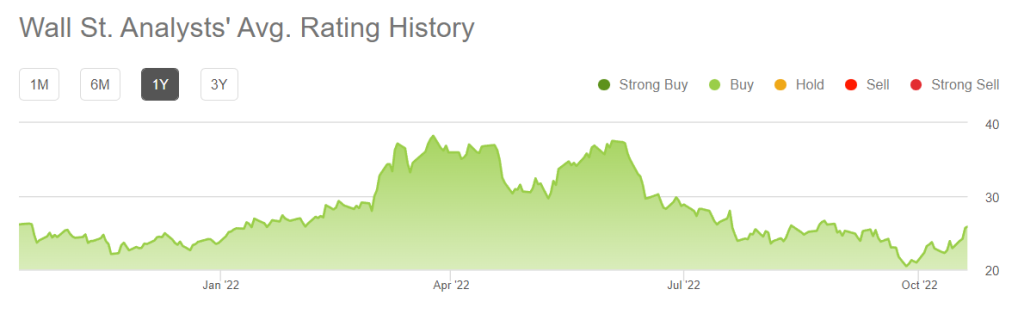
According to data provided by Seeking Alpha, 22 sell-side analysts rated BKR a “Buy” or “Strong Buy” in the past 90 days, while five of them rated it a “Hold.” None of the sell-side analysts rated a “Sell.” The consensus target price is $33, which yields 29% returns at the current price.

What’s The Take On BKR?

A rise in significant LNG projects and international drilling and completion capex will drive BKR in 2023. Latin America, West Africa, and the Middle East will lead the offshore activity recovery. Its global business should benefit from net pricing increases and moderating supply chain pressures. It will consolidate two reportable segments to reduce costs and simplify operations, resulting in at least $150 million in cost savings. Also, the sharp rise in order backlog in the Oilfield Equipment segment can stimulate revenue growth in 2023.

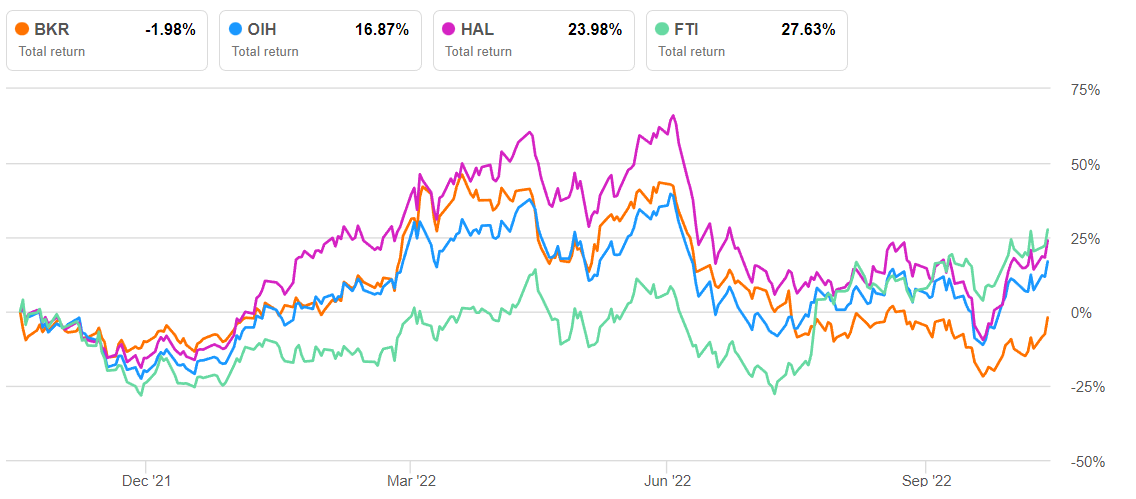
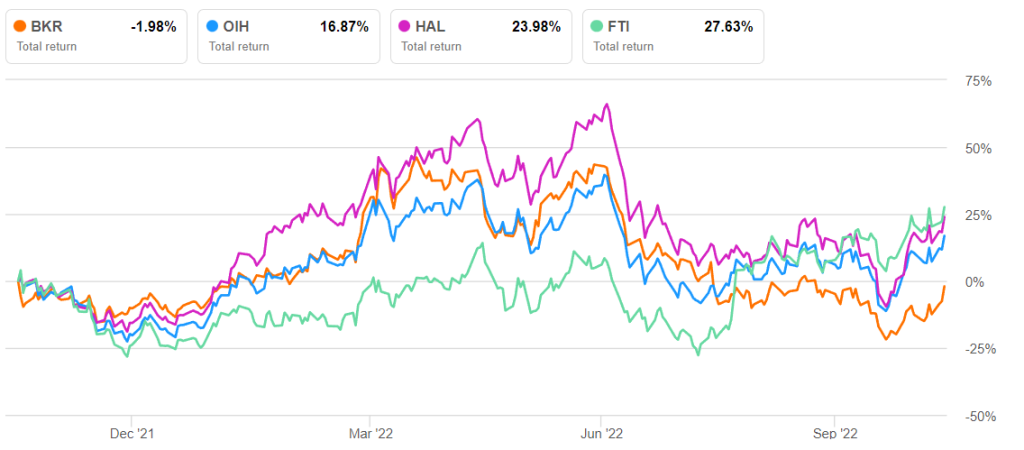
However, natural gas prices can soften in the medium term due to higher US natural gas production in the medium term. The current turmoil in the economy following the high inflation rate and the far-reaching effect of the Ukraine-Russia conflict can spin the world economy into a recession. So, the stock underperformed the VanEck Vectors Oil Services ETF (OIH) in the past year. Nonetheless, natural gas’s role as the medium to long-term driver has continued to be the mainstay of Baker Hughes’s attraction as a preferred investment avenue. It has low leverage and can withstand the pressure of cash flows. The stock is reasonably valued versus its peers. We consider the stock apt for a “hold” for steady returns in the long term.

Previous Post

Baker Hughes Part 1: International Projects Hold Sway Over Economic Uncertainty

Next Post

Year-Over-Year Oil Data (USA)

Related Posts

Halliburton’s Perspective in Q1: KEY Takeaways
Market Trends

Halliburton’s Perspective in Q1: KEY Takeaways

May 16, 2025
STEP Energy Services: Q1 TAKE THREE
Market Trends

STEP Energy Services: Q1 TAKE THREE

May 15, 2025
Market Sentiment Tracker: Demand Holds, Cracks Widen
Market Trends

Market Sentiment Tracker: Demand Holds, Cracks Widen

May 14, 2025
Monday Macro View: What is the connection between Frac Job Count and OPEC’s production? Enterprise Subscribers
Market Trends

Monday Macro View: What is the connection between Frac Job Count and OPEC’s production? Enterprise Subscribers

May 12, 2025
Liberty Energy’s Perspective in Q1: KEY Takeaways
Market Trends

Liberty Energy’s Perspective in Q1: KEY Takeaways

May 12, 2025
KLX Energy Services: Q1 TAKE THREE
Market Trends

KLX Energy Services: Q1 TAKE THREE

May 9, 2025
Next Post
Year-Over-Year Oil Data (USA)

Year-Over-Year Oil Data (USA)

Please login to join discussion

Recent News

Halliburton’s Perspective in Q1: KEY Takeaways

Halliburton’s Perspective in Q1: KEY Takeaways

May 16, 2025
STEP Energy Services: Q1 TAKE THREE

STEP Energy Services: Q1 TAKE THREE

May 15, 2025
FREE READ: Oil Markets Trying to find direction

FREE READ: Oil Markets Trying to find direction

May 14, 2025
Market Sentiment Tracker: Demand Holds, Cracks Widen

Market Sentiment Tracker: Demand Holds, Cracks Widen

May 14, 2025
Monday Macro View: What is the connection between Frac Job Count and OPEC’s production? Enterprise Subscribers

Monday Macro View: What is the connection between Frac Job Count and OPEC’s production? Enterprise Subscribers

May 12, 2025
Primary Vision

Established in 2011, we are renowned for our expert frac data and analytics, providing a rich array of unique indicators and industry commentary.

CONTACT

+1-713-554-4977
info@primaryvision.co

SOCIAL NETWORKS

POLICIES

Privacy Policy
Terms of Use

PARTNERS

Amazon Web Services

TRUSTED SITES

Logo

Logo

RECENT NEWS

Halliburton’s Perspective in Q1: KEY Takeaways

Halliburton’s Perspective in Q1: KEY Takeaways

May 16, 2025
STEP Energy Services: Q1 TAKE THREE

STEP Energy Services: Q1 TAKE THREE

May 15, 2025
FREE READ: Oil Markets Trying to find direction

FREE READ: Oil Markets Trying to find direction

May 14, 2025
Market Sentiment Tracker: Demand Holds, Cracks Widen

Market Sentiment Tracker: Demand Holds, Cracks Widen

May 14, 2025
Monday Macro View: What is the connection between Frac Job Count and OPEC’s production? Enterprise Subscribers

Monday Macro View: What is the connection between Frac Job Count and OPEC’s production? Enterprise Subscribers

May 12, 2025
  • HOME
  • ABOUT US
  • RESEARCH
  • EVENTS
  • PRESS
  • SUPPORT
  • FAQ
  • LATEST NEWS
  • LOGIN
  • SIGN UP!

© 2025 Primary Vision. All rights reserved.

  • HOME
  • ABOUT US
    • ABOUT US
    • PRIMARY VISION AI INNOVATIONS
  • RESEARCH
    • INSIGHTS & ARTICLES
    • FREE ARTICLES
  • EVENTS
  • PRESS
  • SUPPORT
  • FAQ
  • LATEST NEWS
  • LOGIN
  • SIGN UP!
    • FRAC SPREAD COUNT SIGN-UP!
    • ENTERPRISE SUBSCRIPTION PLAN SIGN UP!

© 2025 Primary Vision. All rights reserved.