- Mammoth Energy will add incrementally to its frac fleets in Q4 and Q1 2023.
- It has a competitive advantage in the sand business, which can help raise the sand price further in Q1 2023.
- Despite the US economic uncertainty, the seasonal storm restoration services and the infrastructure project opportunities can brighten its Q4 outlook.
- Although free cash flow was negative, the available liquidity should cover any imminent financial requirements.
The Economic Environment Is Fluid
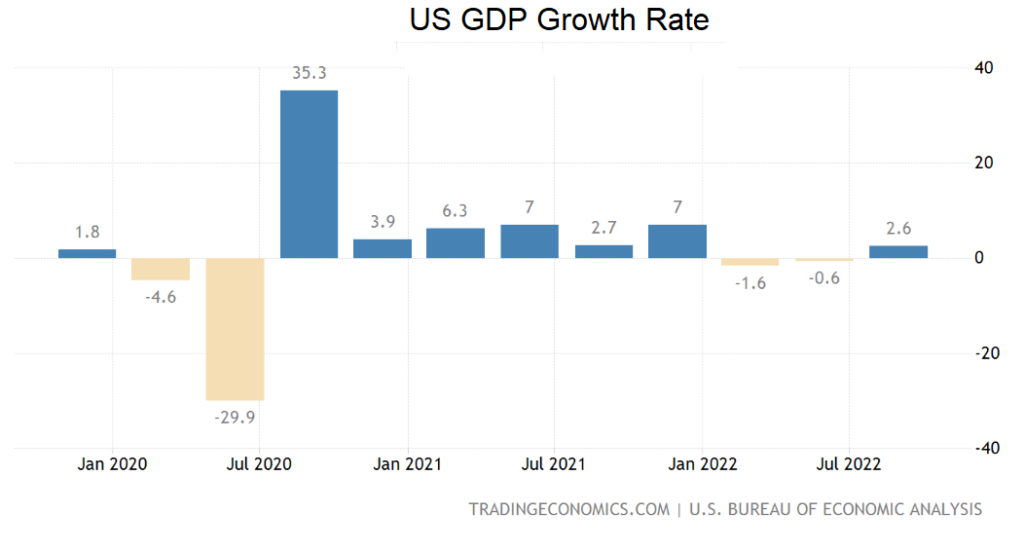
Mammoth Energy Services’ (TUSK) Infrastructure segment accounted for 31% of its Q3 2022 revenues, up from 28% a quarter ago. The $1.2 trillion bipartisan Infrastructure Investment and Jobs Act and the $2.3 trillion Build Back Better Act, signed during 1H 2022, would likely stimulate various infrastructure projects. However, the economic growth contracted in the first two quarters of 2022, technically entering into a recession, before registering a 2.6% growth (annualized) in Q3.
The rebound came primarily in the trade as the US import dropped and exports went up significantly (14% up) in Q3. Higher exports of petroleum products, nonautomotive capital goods, and financial services highlighted the shift in Q3. The housing market, however, continued to struggle with a soaring mortgage rate. Consumer spending was resilient in Q3. We think the company’s infrastructure business will benefit from the need for seasonal storm restoration services and overall infrastructure project opportunities. Among the risk factors, the PREPA-related matter drags on, as we discussed in our previous article. In September, the company provided an update that Puerto Rico continued to owe $350 million to the company for restoring the grid in 2017. With much of its accounts receivable trapped in the PREPA contracts, negative cash flows in 9M 2022 put some strain on its finances.
Oilfield Services: Industry And Outlook
In Q4, TUSK’s oilfield services business will likely see a demand surge. EBITDA in the Well Completion segment should increase compared to Q3, while the infrastructure segment EBITDA can remain steady in Q4. There is some potential upside in the event of storm work, though.
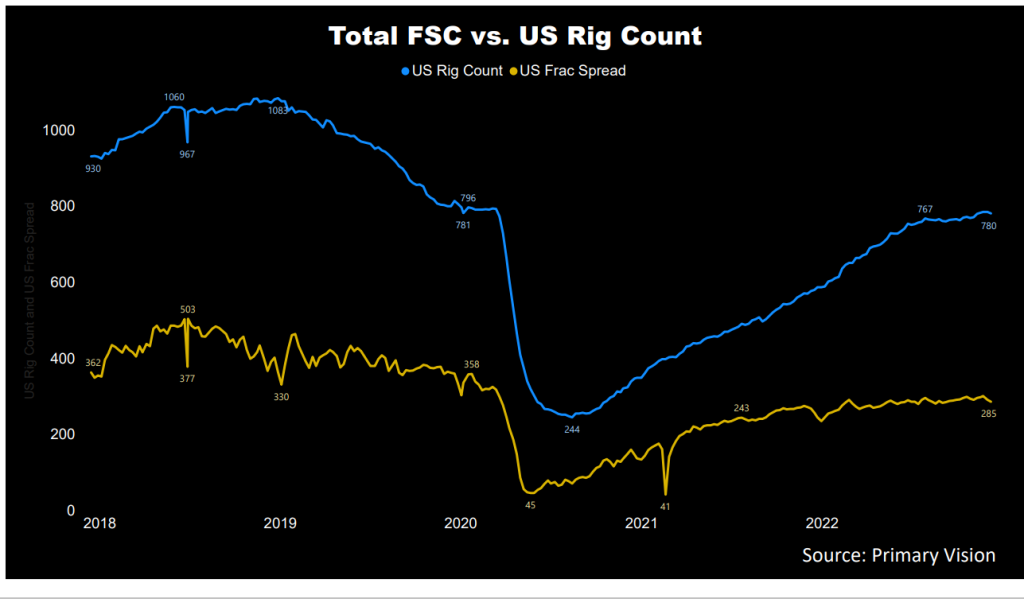
Let us look at the industry drivers to understand where the growth would come from. From January 2022 to October 2022, the drilled and completed well count was higher (32% and 11% up, respectively), while the drilled but uncompleted (or DUC) wells declined by 11%. Year-to-date, the active frac spread count went up by 22%, according to Primary Vision’s estimates. Mammoth Energy operated four hydraulic fracturing fleets in Q3, unchanged from Q2. It expects to activate the fifth fleet in Q4 and a sixth in Q1 2023. It will also have three dual-fuel fleets at that time. Pricing also improved in Q3, enabling it to rake in higher profitability.
The company’s sand business will have a strategic advantage in Q4 and early 2023. It has a substantial wet sand pile that can dry and size according to demand. Not many of its competitors have that capability. So, the management considers the competitive advantage to give the ability to raise the sand price further in Q1 2023. During this period, the company’s average sand price increased by 11.5% while sand volume decreased by 2.6%. It experienced some railroad constraints that reduced total volume. The management expects the transportation issues to resolve going forward.
Recent Drivers: Q3 2022
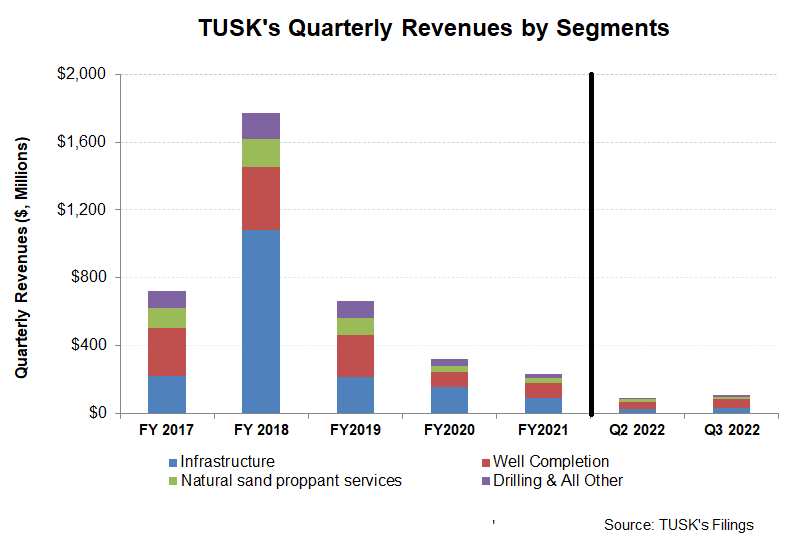
As the industry indicators somewhat flattened, TUSK’s frac fleet remained nearly unchanged at 3.5 in Q3 from a quarter earlier. Its topline increased by ~20% sequentially, due primarily to the robust well-completion services segment growth as the macroeconomic environment improved. Plus, increased demand and higher pricing in well completions, sand, and infrastructure led to the revenue rise.
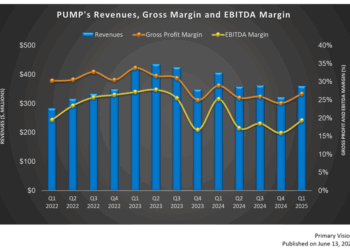
In Q3, the company recorded a net income of $7.7 million compared to a net income of $1.7 million in Q2. Its Q2 adjusted EBITDA margin sequentially expanded by 350 basis points. The adjusted EBITDA growth resulted in pricing momentum in the well-completion services and the sand business.
Low Leverage, Negative FCF, Capex To Rise
As of September 30, 2022, TUSK’s liquidity (excluding working capital but revolving credit facility available) was $17.5 million. Its cash flow from operations (or CFO) remained negative in 1H 2022 versus a year ago but showed some improvements, led by higher year-over-year revenues.
As a result, free cash flow remained negative in 9M 2022. The company’s leverage (debt-to-equity) is low (0.21x). The management expects the FY2022 capex to be $20 million, which would be significantly higher than FY2021. Despite negative cash flows in 9M 2022, the management expects to fund its FY2022 capex with cash flow from operations and available liquidity.
Learn about TUSK’s revenue and EBITDA estimates, relative valuation, and target price in Part 2 of the article.