Primary Vision
  • HOME
  • ABOUT US
    • ABOUT US
    • PRIMARY VISION AI INNOVATIONS
  • RESEARCH
    • INSIGHTS & ARTICLES
    • FREE ARTICLES
  • EVENTS
  • PRESS
  • SUPPORT
  • FAQ
  • LATEST NEWS
  • LOGIN
  • SIGN UP!
    • FRAC SPREAD COUNT SIGN-UP!
    • ENTERPRISE SUBSCRIPTION PLAN SIGN UP!
  • HOME
  • ABOUT US
    • ABOUT US
    • PRIMARY VISION AI INNOVATIONS
  • RESEARCH
    • INSIGHTS & ARTICLES
    • FREE ARTICLES
  • EVENTS
  • PRESS
  • SUPPORT
  • FAQ
  • LATEST NEWS
  • LOGIN
  • SIGN UP!
    • FRAC SPREAD COUNT SIGN-UP!
    • ENTERPRISE SUBSCRIPTION PLAN SIGN UP!
No Result
View All Result
Primary Vision
Home Market Trends

Nabors Industries Part 2: Estimates And Relative Valuation

Avik Chowdhury by Avik Chowdhury
February 14, 2023
in Market Trends
0

  • Our regression model suggests that NBR’s revenue will increase sharply in NTM 2023 but may decelerate later.
  • Similarly, the EBITDA estimates point to s sharp slowdown in NTM 2024 after solid growth in NTM 2023.
  • The stock is reasonably valued versus its peers at the current level.

Part 1 of this article discussed Nabors Industries’ (NBR) outlook, performance, and financial condition. In this part, we will discuss more.

Linear Regression Based Forecast

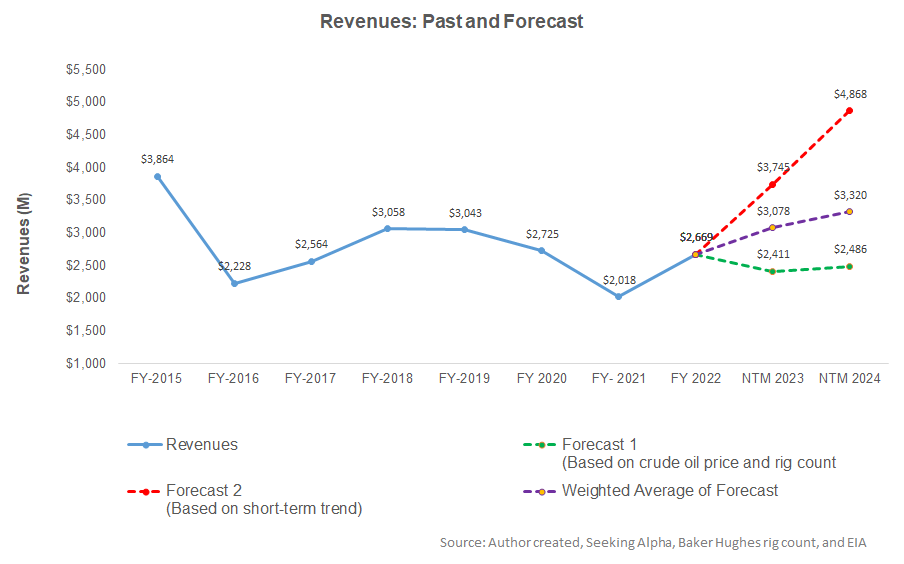
Observing a regression model based on the historical relationship among the crude oil price, rig count, and NBR’s reported revenues for the past eight years and the previous four quarters suggests that NBR’s revenues will increase by 15% in the next 12 months (or NTM 2023). It can grow further, but at a decelerated rate (8% up), in NTM 2024. For the short-term trend, we have also considered seasonality.

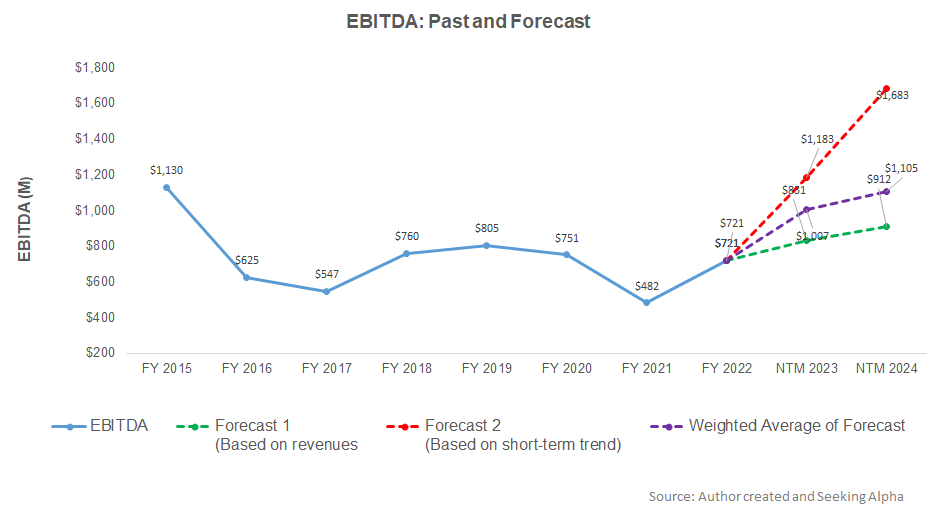
Based on the regression models and the average forecast revenues, the company’s EBITDA will increase by 20% in the next 12 months (or NTM) in 2023. In NTM 2024, the model suggests the company’s EBITDA growth will decelerate to 10%.

Target Price And Relative Valuation

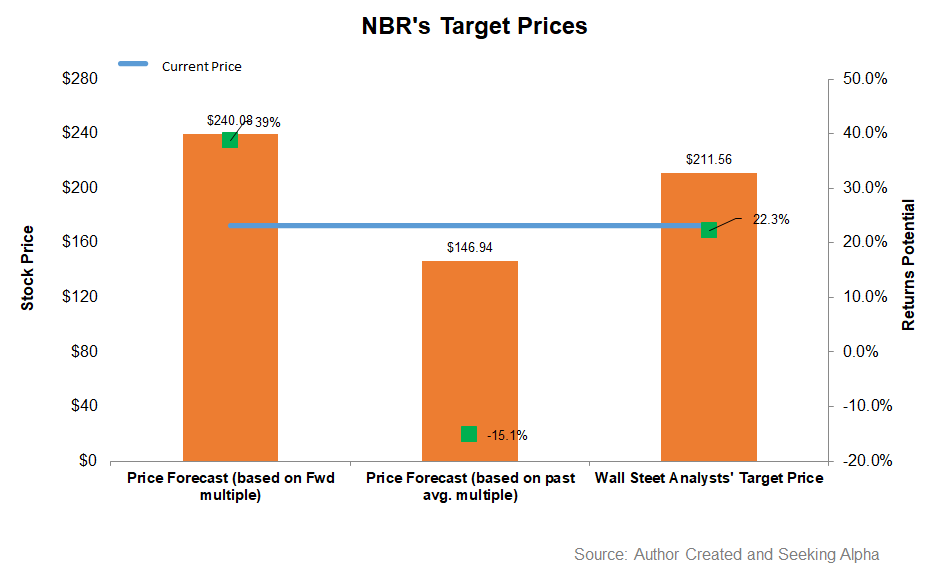
The stock’s returns potential using the forward EV/EBITDA multiple (4.2x) is higher (39% upside) than the returns potential (15% downside) using the past five-year average multiple (7.1x). In comparison, Wall Street’s sell-side analysts expect 22% returns from the stock.

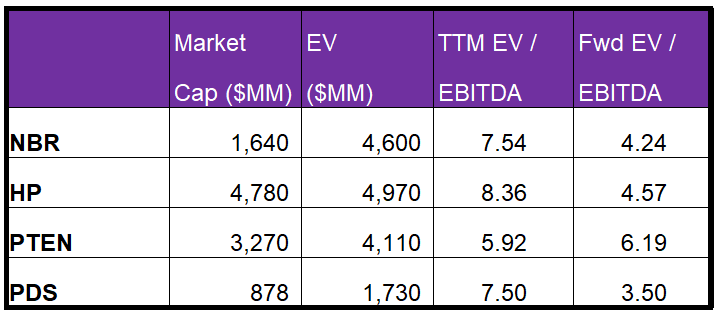
NBR’s forward EV-to-EBITDA multiple contraction versus the current EV/EBITDA is steeper than its peers, typically resulting in a higher EV/EBITDA multiple than its peers. The company’s EV/EBITDA multiple (7.5x) is in line with its peers’ (HP, PTEN, and PDS) average of 7.3x. So, the stock is reasonably valued versus its peers at this level.

Analyst Rating And Target Price

According to data provided by Seeking Alpha, three sell-side analysts rated NBR a “buy” in the past 90 days (including “Strong Buy”), while five of the analysts rated it a “hold.” Two of the analysts rated it a “sell” (includes “strong sell”). The consensus target price is $200.7, suggesting a 7% upside at the current price.

What’s The Take On NBR?

As the leading-edge day rates recovery pushes through, NBR is starting to tweak its strategy of going short on contract duration and looks to extend the duration. It plans to concentrate on the most capable rigs and focus on premier fields. With the reactivation of high-spec rigs and elements of NDS added, revenues can go higher. International operations bring more opportunities for NBR. In Q4, it received five awards for new builds for its joint venture in Saudi Arabia (SANAD). Also, the company’s focus on technology also helped it increase the Drilling Solutions segment EBITDA in Q4.

NBR’s declining cash flows due to huge working capital requirements have been a concern. As a result, the stock underperformed the VanEck Vectors Oil Services ETF (OIH) in the past year. Although it has deleveraged the balance sheet, its leverage remains high compared to its peers. The stock is marginally undervalued versus its peers. However, investors may note that the reactivation costs are also high, limiting margin expansion. As the margin outlook strengthens, investors might want to hold it for gains in the medium term.

To unlock the content you need a
Premium
or Enterprise
Account!

Previous Post

Inflation, LNG demand and electricity

Next Post

Year-Over-Year Oil Data (USA)

Related Posts

Monday Macro View: How does Frac Job Count explains the divergence in global and U.S. inventories?
Market Trends

Monday Macro View: How does Frac Job Count explains the divergence in global and U.S. inventories?

July 7, 2025
Market Sentiment Tracker: Mixed Signals from Global Economy
Market Trends

Market Sentiment Tracker: Mixed Signals from Global Economy

July 1, 2025
Monday Macro View: Is the Global Oil Sector Deteriorating?
Market Trends

Monday Macro View: Is the Global Oil Sector Deteriorating?

June 30, 2025
STEP Energy Services’ Perspective in Q1: KEY Takeaways
Market Trends

STEP Energy Services’ Perspective in Q1: KEY Takeaways

June 30, 2025
KLX Energy Services’ Perspective in Q1: KEY Takeaways
Market Trends

KLX Energy Services’ Perspective in Q1: KEY Takeaways

June 28, 2025
Monday Macro View: Why Oil Prices Are Not Rising ?
Market Trends

Monday Macro View: Why Oil Prices Are Not Rising ?

June 23, 2025
Next Post
Year-Over-Year Oil Data (USA)

Year-Over-Year Oil Data (USA)

Please login to join discussion

Recent News

Monday Macro View: How does Frac Job Count explains the divergence in global and U.S. inventories?

Monday Macro View: How does Frac Job Count explains the divergence in global and U.S. inventories?

July 7, 2025
Market Sentiment Tracker: Mixed Signals from Global Economy

Market Sentiment Tracker: Mixed Signals from Global Economy

July 1, 2025
Monday Macro View: Is the Global Oil Sector Deteriorating?

Monday Macro View: Is the Global Oil Sector Deteriorating?

June 30, 2025
STEP Energy Services’ Perspective in Q1: KEY Takeaways

STEP Energy Services’ Perspective in Q1: KEY Takeaways

June 30, 2025
KLX Energy Services’ Perspective in Q1: KEY Takeaways

KLX Energy Services’ Perspective in Q1: KEY Takeaways

June 28, 2025
Primary Vision

Established in 2011, we are renowned for our expert frac data and analytics, providing a rich array of unique indicators and industry commentary.

CONTACT

+1-713-554-4977
info@primaryvision.co

SOCIAL NETWORKS

POLICIES

Privacy Policy
Terms of Use

PARTNERS

Amazon Web Services

TRUSTED SITES

Logo

Logo

RECENT NEWS

Monday Macro View: How does Frac Job Count explains the divergence in global and U.S. inventories?

Monday Macro View: How does Frac Job Count explains the divergence in global and U.S. inventories?

July 7, 2025
Market Sentiment Tracker: Mixed Signals from Global Economy

Market Sentiment Tracker: Mixed Signals from Global Economy

July 1, 2025
Monday Macro View: Is the Global Oil Sector Deteriorating?

Monday Macro View: Is the Global Oil Sector Deteriorating?

June 30, 2025
STEP Energy Services’ Perspective in Q1: KEY Takeaways

STEP Energy Services’ Perspective in Q1: KEY Takeaways

June 30, 2025
KLX Energy Services’ Perspective in Q1: KEY Takeaways

KLX Energy Services’ Perspective in Q1: KEY Takeaways

June 28, 2025
  • HOME
  • ABOUT US
  • RESEARCH
  • EVENTS
  • PRESS
  • SUPPORT
  • FAQ
  • LATEST NEWS
  • LOGIN
  • SIGN UP!

© 2025 Primary Vision. All rights reserved.

  • HOME
  • ABOUT US
    • ABOUT US
    • PRIMARY VISION AI INNOVATIONS
  • RESEARCH
    • INSIGHTS & ARTICLES
    • FREE ARTICLES
  • EVENTS
  • PRESS
  • SUPPORT
  • FAQ
  • LATEST NEWS
  • LOGIN
  • SIGN UP!
    • FRAC SPREAD COUNT SIGN-UP!
    • ENTERPRISE SUBSCRIPTION PLAN SIGN UP!

© 2025 Primary Vision. All rights reserved.