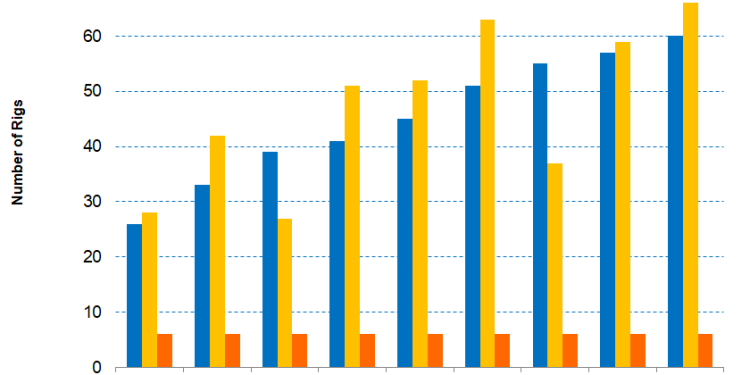
- In the US, PDS’s management expects to keep the US rig count nearly unchanged in Q1.
- It expects to reprice its contracted rigs with the improving leading edge rates.
- In Kuwait, it will add two rigs in early-2023, but some of the rigs in this region may also go offline and undergo certification.
- Free cash flow turning positive is a bonus in FY2022, leading to lower debt and net-debt-to-adjusted EBITDA.
Technology Outlook And Canada Business
In 2023, PDS’s strategy is to promote high-performance, high-value products like Alpha and EverGreen, driving field margins towards 50% in North America and maximizing free cash flow. Its other objectives are tightening the leverage target and prioritizing 10%-20% free cash flow for share repurchases. With a target of sustaining 90% utilization on its US Super Triple fleet, it re-contracted six natural rigs for five years. These rigs have $800 million of contracted international backlog. During 2022, AlphaAutomation and EverGreen product lines will help penetrate the market, as we discussed in our previous article.
In Canada, the number of drilling rigs operated by PDS increased 27% in the past year until Q4 2022. Daily operating margins during this period increased by 54%. The management expects a higher percentage of shallower rigs and the adverse effects of seasonality on boiler revenue and pricing renewals to offset the positive momentum, leaving the Q1 daily operating margins unchanged compared to Q4.
Oil Price In Canada
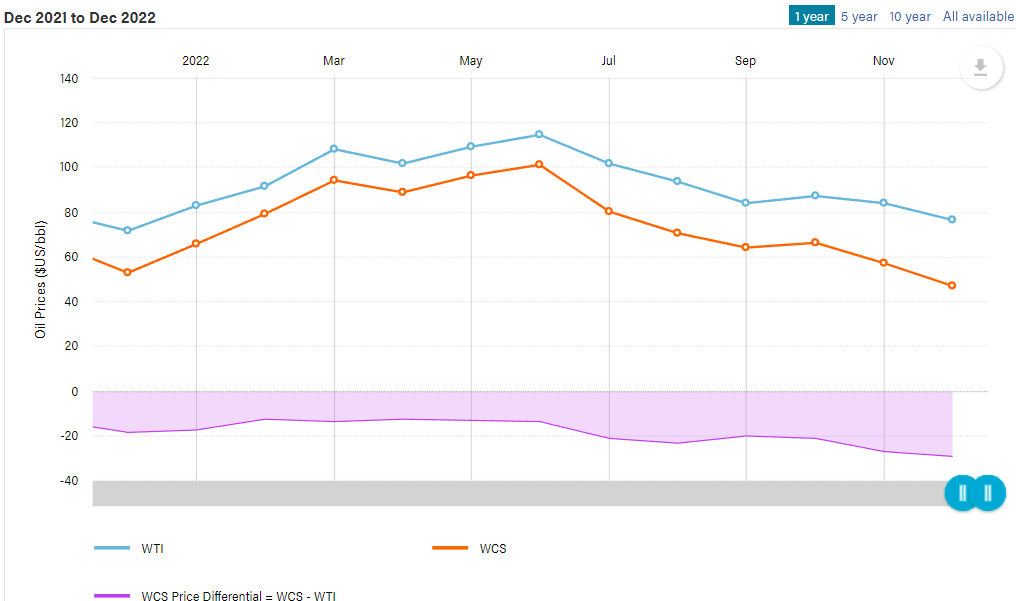
The WCS (Western Canada Select)–WTI (West Texas Intermediate) spread is a crucial indicator of Canadian energy companies performance. The WTI price averaged $94.7 a barrel from January to December, 39% higher than a year ago. WCS averaged ~$76, or 38.5% higher than a year ago. Since the spread deteriorated (i.e., the spread expanded) in 2022, expect the impact to be negative on PDS in Q1.
US Market Outlook
In the US, PDS’s management expects customer demand will remain moderate. While rig demand underperformed crude oil price’s steep hike in the first half of 2022, it should also stay insulated from the commodity volatility as we saw in the latter half of 2022. Plus, the risks of a global recession-led demand pullback hang. Therefore, it expects to keep the US rig count nearly unchanged at 61 in Q1. However, the company’s EverGreen solutions will penetrate the onshore market more in 2023 due to its ability to bring in the advantages of diesel fuel savings and GHG reduction.
In Q1, it expects the average daily operating margins to increase by 17% compared to Q4. Investors may also note that over the past year until Q4 2022, the margin more than doubled. However, it expects to reprice its contracted rigs with the leading edge rates as contracts renew.
International Market Outlook
The company averaged six rigs in Q4, while the average day rates were down by 4% from a year ago due to adverse changes in the active rig mix. It expects to add two additional rigs in Kuwait in early-2023. However, the rig additions won’t have the much-desired effect on 2023 performance because some of these rigs will go offline and undergo certification in 1H 2022. In 2024, drilling activity should increase by more than 30% compared to 2023.
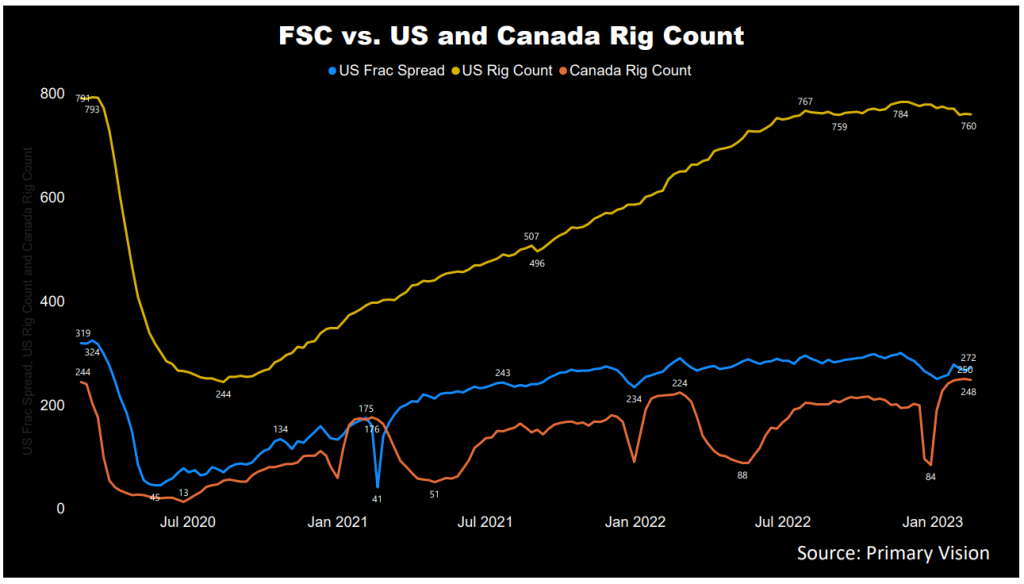
As estimated by Primary Vision, the frac spread count (or FSC) reached 272 by the third week of February and has inched marginally down over the past year. Over the past month, we saw 11 frac fleets removed from the count in the US. At the same time, the rig count in Canada increased by 14. The recovery in drilling activity, especially in Canada, is a positive for PDS. A falling frac count, however, is harmful to PDS’s growth.
Utilization And Other Key Metrics
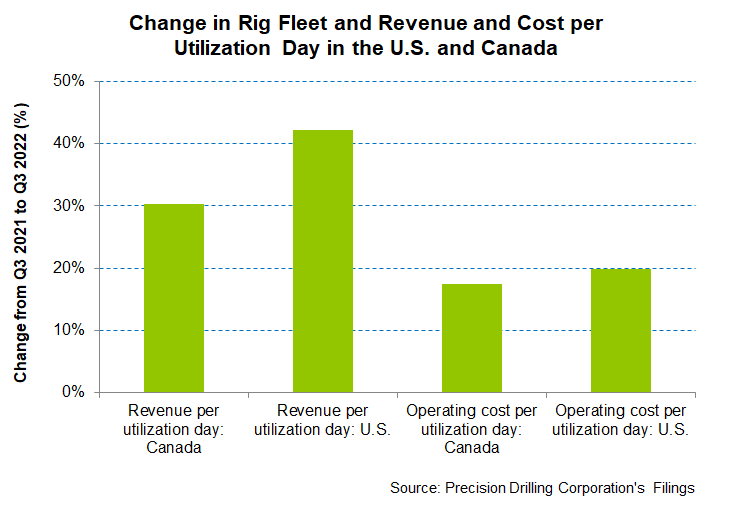
During Q4, PDS benefited from higher day rates and drilling rig utilization days. Between Q4 2021 and Q4 2022, Canada’s average revenue per utilization day increased by 30%. Operating cost per utilization day fell short of the revenue growth (17% rise), leading to a 640 basis points operating margin expansion.
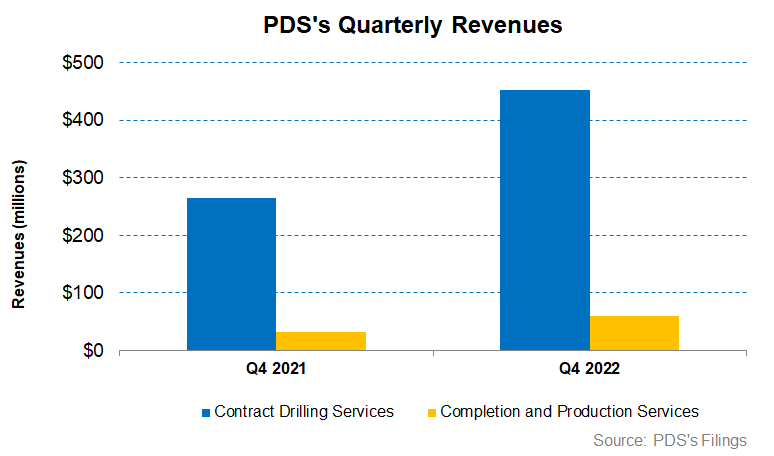
The company added 15 drilling rigs in the US between Q4 2021 and Q4 2022. The average revenue per utilization day increased by 42% in the US in Q4 compared to a year ago. Operating cost per utilization day went up by 20%, leading to a 103% higher operating profit in the past year.
Debt And Cash Flows
In FY2022, PDS’s cash flow from operations (or CFO) increased by 70% compared to a year ago, led by the rise in revenues during this period. In FY 2022, capex increased significantly, leading to a 16% free cash flow (or FCF) decline in FY 2022 compared to a year ago. In 2023, it expects to generate strong free cash flow. Much of the capex is front-end loaded, while the working capital requirements may also increase in 1H 2023.
As of December 31, 2022, the company’s leverage (debt-to-equity ratio) of 0.88x was much lower than its peers’ (HP, NBR, PTEN) average of 1.8x. It plans to reduce debt by CAD 150 million in 2023. Its net debt to adjusted EBITDA ratio is 3.4x, while it expects to lower it to 1.25x-1.5x by 2023-end. The available liquidity was $600 million as of December 31.
Learn about PDS’s revenue and EBITDA estimates, relative valuation, and target price in Part 2 of the article.

