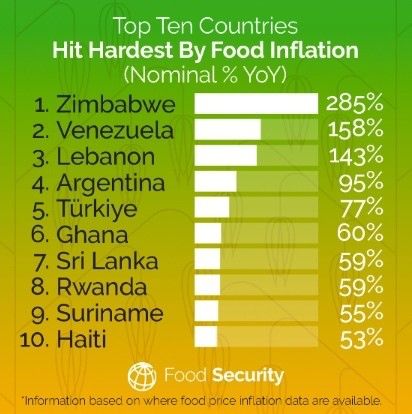
Last week we explored the rolling recessions, mixed signals and the issues in the developing countries. This week I thought to focus on a number of issues, just to give our readers an overview of what’s going around. I will specifically talk about a few things tomorrow at our Monday Macro View. Before I show you any charts or data it is important to understand where does the global economy stands as a whole. Nothing much has changed from the past 2 years or so. What started with the pandemic purchase programs – an unprecedented influx of money (M2) – has now culminated into a global montary policy tightening which has further created problems for the global economy taht was already reevoering form the effects of the pandemic. Russia Ukrainian war has further exacerbated the dincators causing a spike in inflation levels – especially food price inflation – across the world.
I’d like to start with this very interesting chart that shows the heroic efforts by the EU to reduce its gas consumption by 19 percent which was even more than the government mandated 15 percent.
This is very impressive and many people are claiming that it has happened without a decline in economic activity or output. Now that is where it gets problematic. I haven’t been able to find any write-up on this (everyone seems to have accepted it) but if we look at other indicators we see that apart from the fact that Europe got lucky due to a warmer weather than usual, the actual drop in gas consumption might have been due to falling or slowing economic activity – the opposite of what is being claimed.
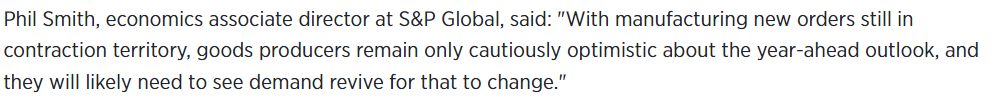
For instance, equities in France slid due to the persistently challenging conditions that the manufacturing sector face. France’s PMI has dropped to a four month low. Recently, France just escaped a recession as the economy grew by 0.1 percent. PMI for France’s manufacturing sector is down from 50.5 to 47.1. Germany’s manufacturing index also fell to 46.5

A few days ago Germany’s manufacturing PMI figures were released as well that came out at a 3 month low. New manufacturing orders are down due to a “sustained sharp drop in export sales”.

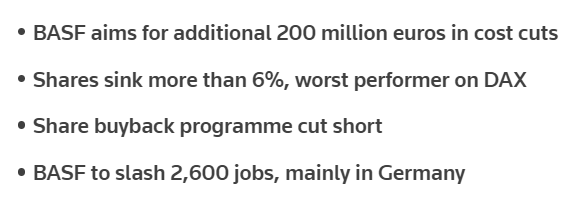
Furthermore, as highlighted by Shaan, senior economist at Vanguard, that there are still challenges to Europe’s economic recovery. He specificaly talks about what I have mentioned here – the growth figures coming out of the EU. It turns out that due to the disruptions to global supply chains certain sectors have grown such as car production (which by the way will also take some downward pressure as the chip war between US and China escalates), semiconductors, and machinery. Energy intensive sectors such as chemicals, wood, paper and metals remain in a slowdown. This can be seen as BASF, the German chemical giant, is planning to cut 2600 jobs, cut its share buyback programme and is planning for a whipping 200 million euros of cost cuts as it loses its battle against rising energy price.
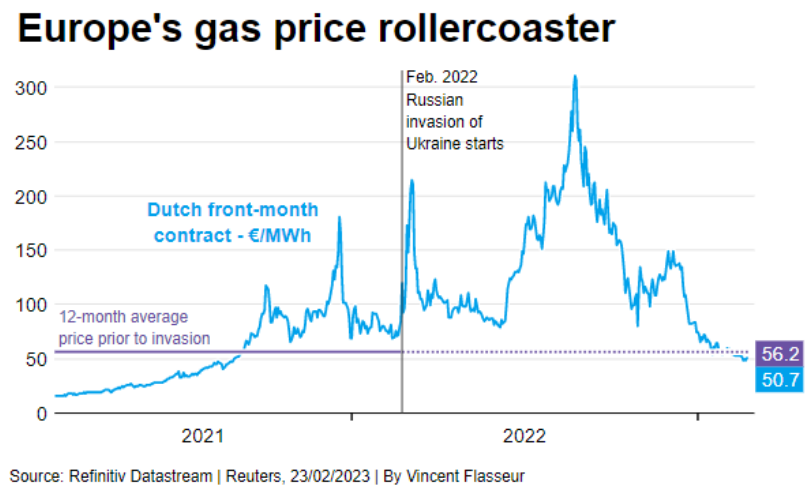
It should be noted here that despite a recent fall in energy prices, they are still high in historic terms. For example natural gas prices are 250 percent higher than its 2018-19 averages. Furthermore, as Shaan highlights, the overall possibility of an escalation in Ukrainian conflict still exists. Therefore it is too early to call for a change of direction in terms of Europe’s economic output.
So let’s just say that the fall in gas consumption wasn’t without any consequences.
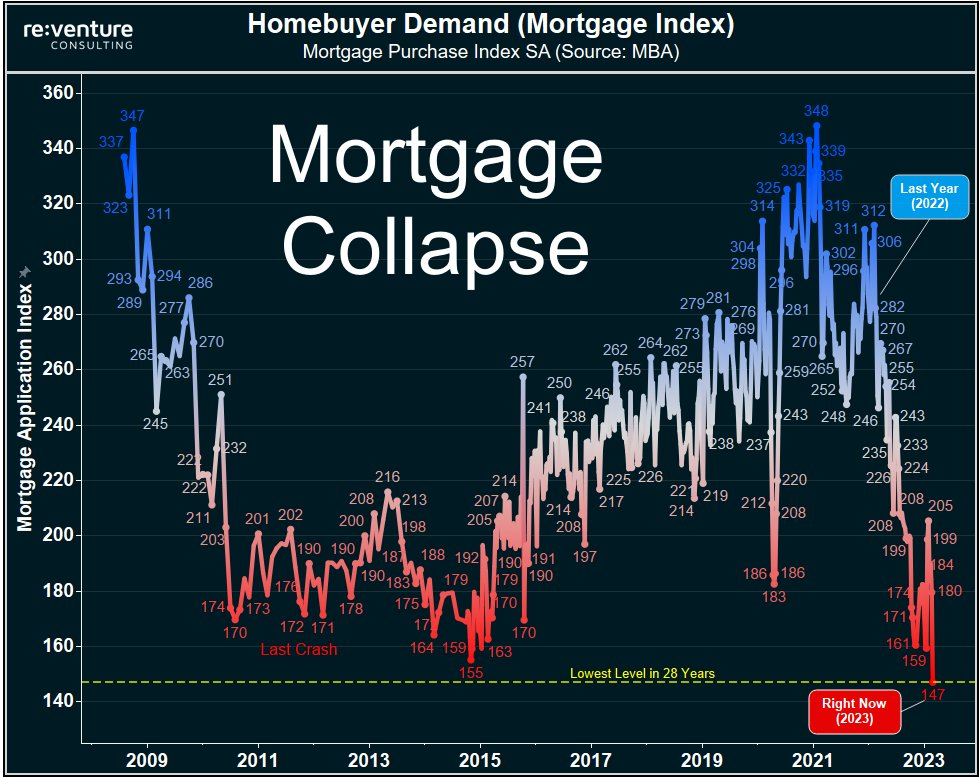
Moving on to the next development: housing markets. Housing is in shambles – we have all seen those alarming charts that show how sales have fallen to multidecade low.
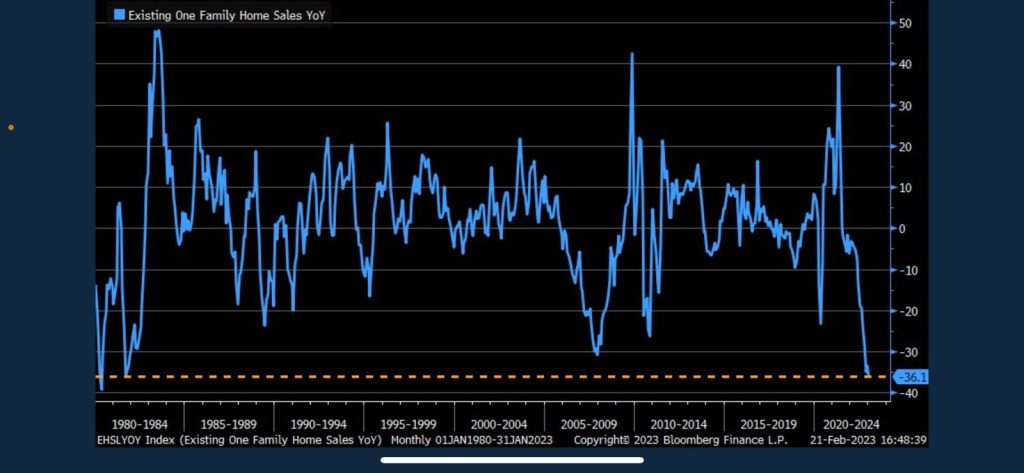
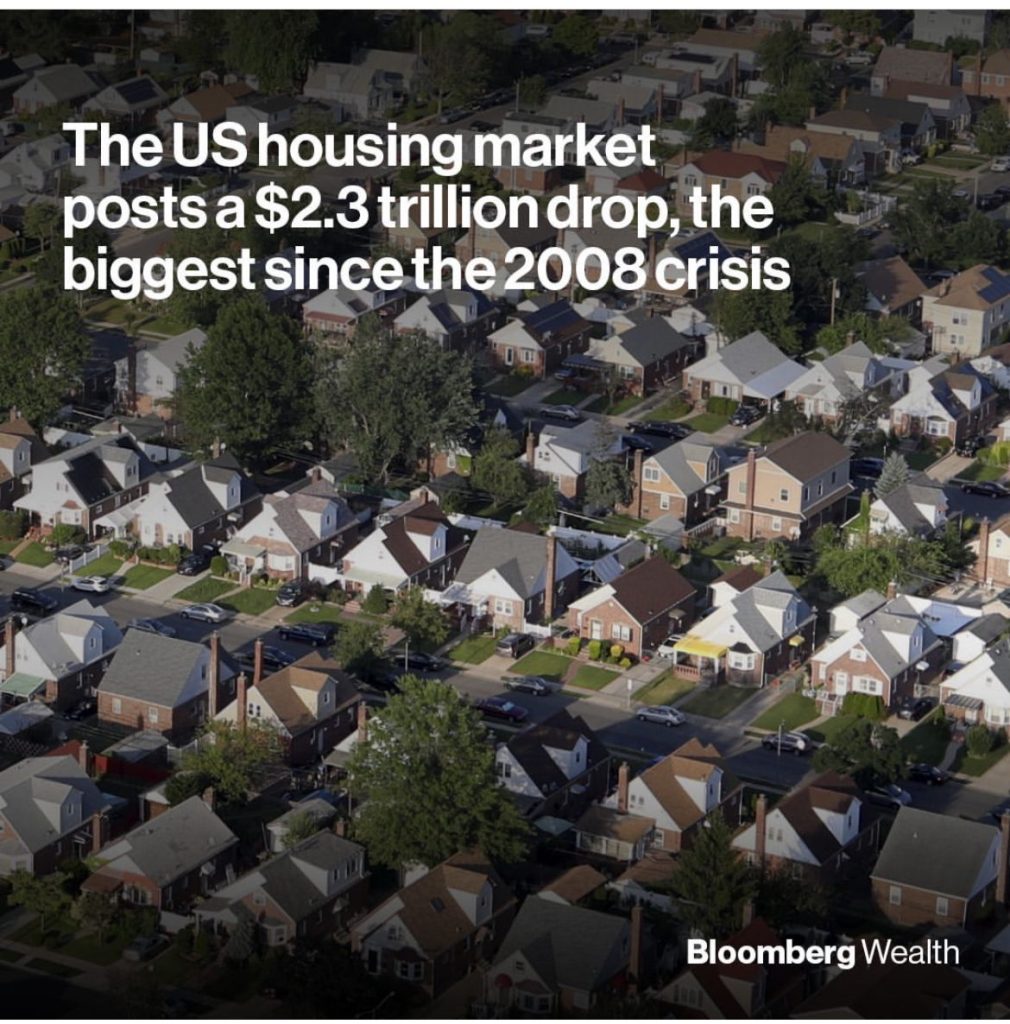
I cannot add much to this as the charts are self explanatory. Did you know that US housing market has registered a drop of about $2.3 trillion – the biggest since 2008 financial crisis.
Mortgage demand is also collapsing:
Now something on recession and inflation. First of all this chart below caught my attention.
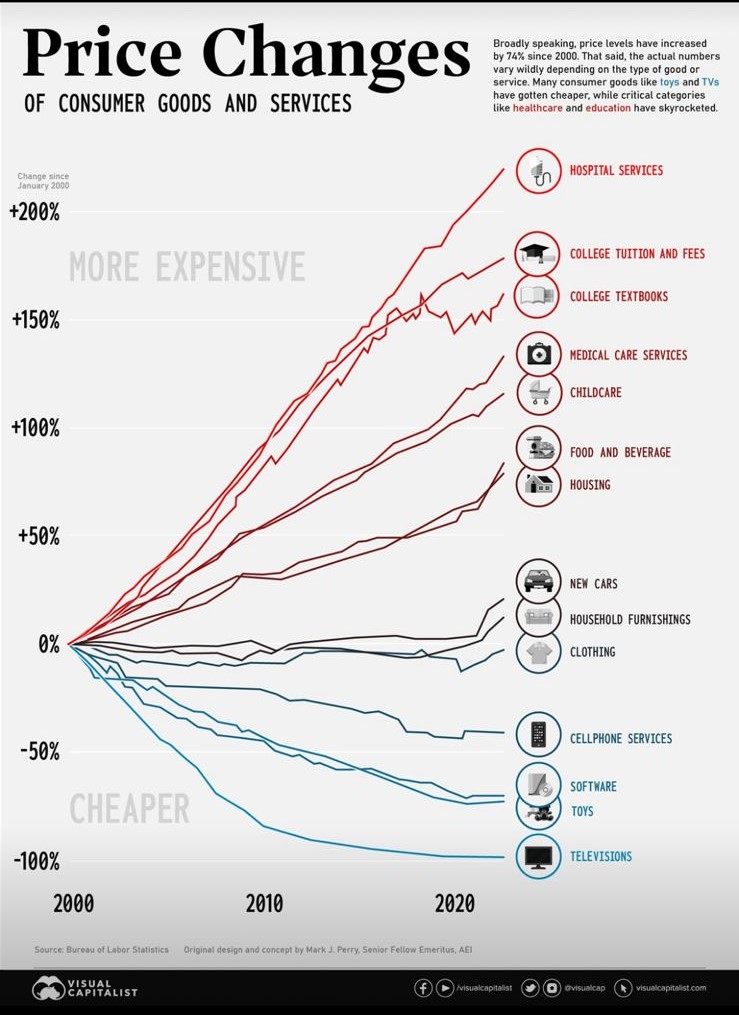
All the major and significant sector, products or domains have experienced a price change of more than 50 percent going all the way to 200 percent. It is sad to see that things like healtcare has registered one of the most pronounced change since 2000. This speaks to the current level of inflation as well and when we say there has been 1 percent drop in inflation – what does that actually mean? If there can be a rolling recession – why can’t there be a rolling rate of inflation effecting each sector at a specific time and sticky versus flexible inflation with the former spreading to certain ectors (that are important and have inelastic demand such as food, healthare, transport) while being flexible in others (like toys etc). That’s a topic for another time.
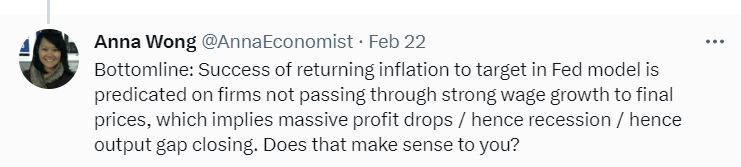
Anna Wong (Twitter handle: @AnnaEconomist) highlights interesting points in her tweet where she shows that how Fed is expecting a further downturn in economy as shown by the output gap below.
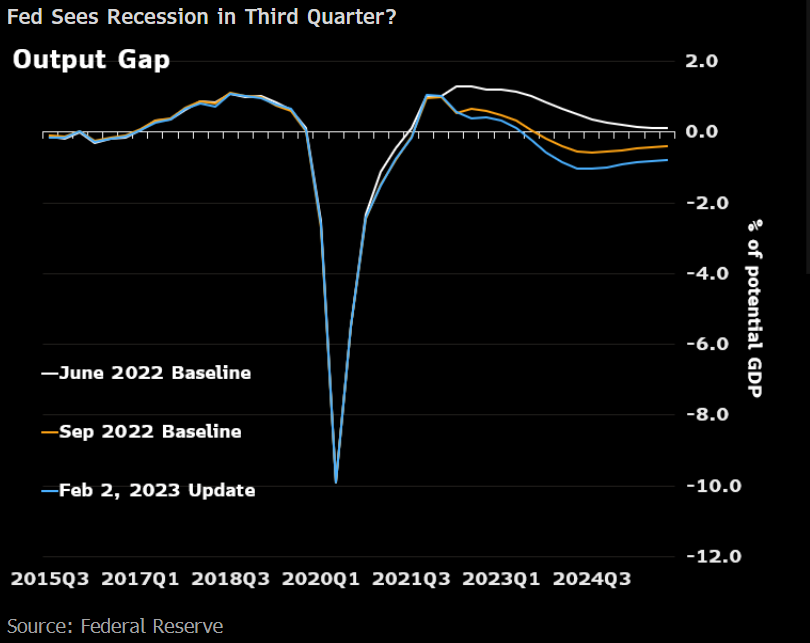
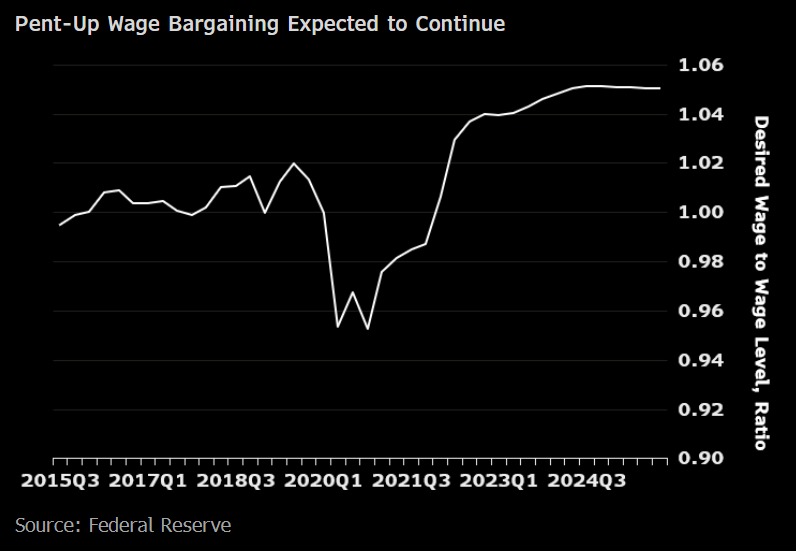
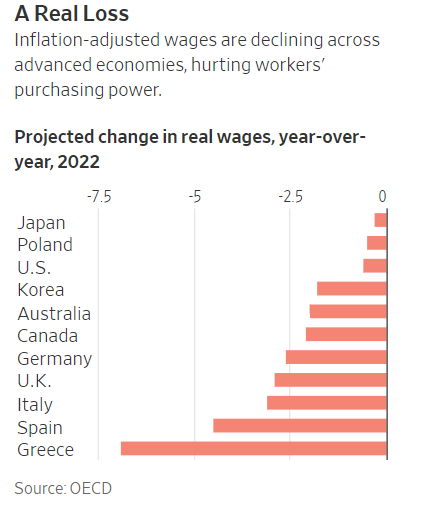
The inversted yield curve and inflation expectations show that there will be an upward pressure on wages
So, per Anna, Fed is expecting to tune down to a 2 percent inflation target on the assumption that wage increases by the firms won’t be passed on to the consumers but wait! Won’t this reduce profits, and output and isn’t that what is called a recession? She asks the same question.
More on wages:
Whether wages will remain sticky or not is another question – I will try to address it in a different post.
But that is all from today. Once again there are conflicting signals. I’ll see you all tomorrow ! Happy Reading – Happy Sunday!