
- FTI started 2023 with several projects amounting to $1.0 billion.
- In FY2023, its backlog could be ~20% higher than the previous year, as much of the growth would emanate in Subsea services.
- However, in Q1 2023, it plans to restructure its operations in North America, which can lower the topline growth.
- The company’s free cash flows turned positive in FY2023; however, the management’s decision to repurchase at a lower-than-market rate signals uncertainty over its share price.
The Project Layout
FTI’s management puts sufficient confidence in its notion that international offshore markets will lead the expansion, much of which would come from the Middle East. Investors may note that international markets account for over 90% of its revenues. In Subsea, a larger project with more than two years duration offers significant growth opportunities because of the expanding customer base in the offshore basins. The company estimates the average project size here has grown to ~$750 million following many greenfield projects. In particular, opportunities in tieback activity in the Gulf of Mexico, the North Sea, and West Africa have come up for FTI. Read more about FTI’s strategies in our previous article.
Let us look at the prominent projects that FTI has bagged recently. It started 2023 with several projects amounting to $1.0 billion, including an iEPCI project in Norway from Aker BP. The total value of iEPCI awards should increase in 2023 because these are mainly integrated project awards. This will lead to higher subsea services activity. IEPCI and Subsea services are expected to account for 70% of its total inbound orders in 2023. Apart from offshore, it expects to invest significantly in the Middle East onshore activity.
Segment Forecast
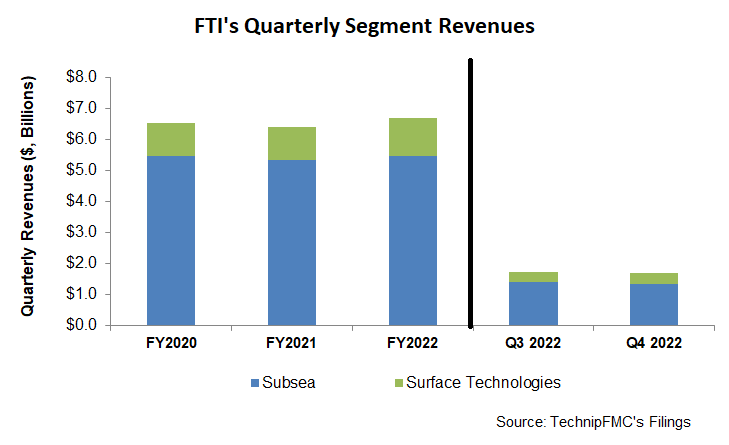
In FY2023, FTI’s management expects Subsea segment revenues to increase by 11.7% compared to FY2022, while it expects its Subsea EBITDA margin to extend by 20%. Much of the growth typically happens in Q2 and Q3, which means growth will be limited or may see a mild decline in Q1 2023 due to the typical weather-related seasonality.
In Surface Technologies, the management expects revenues to increase by 11% in FY2023, while it expects its Subsea EBITDA margin to extend by 30%. The ramp-up in activity in Saudi Arabia and the United Arab Emirates will account for much of the topline growth in 1H 2023. On the other hand, North America can experience a decline because the company will restructure its operations in this region to eliminate underperforming assets, leading to lower revenues in the short term. So, in Q1 2023, the segment revenue can decline by 10%, while the EBITDA can decrease by 30%.
Backlog Forecast And Its Impact
FTI ended the year with $8.13 billion in the backlog. In FY2023, its backlog could exceed $8 billion, which is ~20% higher than the previous year. Given the robust backlog, the company’s revenues can increase by 12% in FY2023 versus FY2022, shared almost equally between its two operating segments. Much of the growth would emanate from Subsea services. However, in Surface Technologies, international territories will likely grow faster than the US.
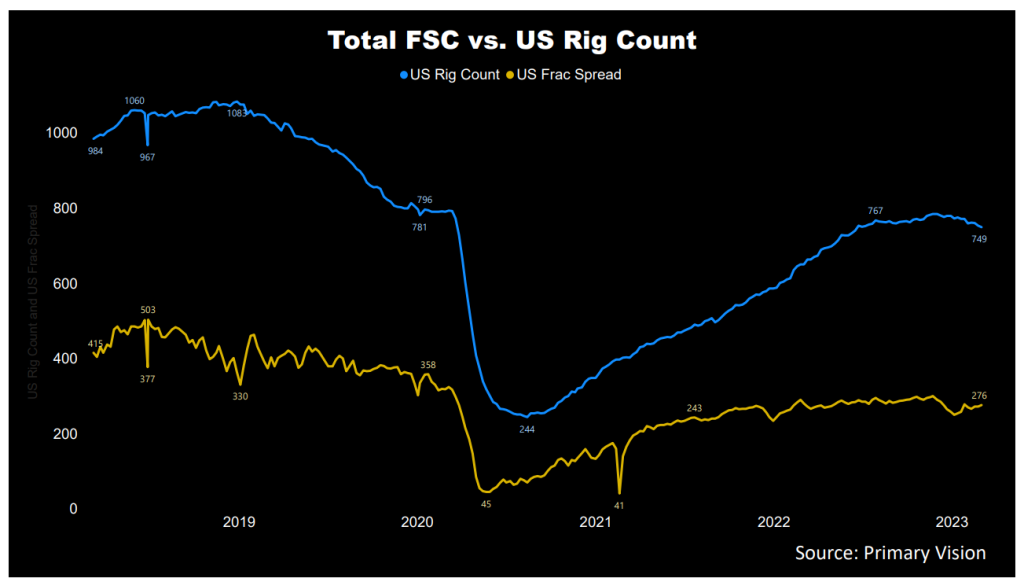
According to Primary Vision, the frac spread count has recovered in 2023 to 276 by the first week of March compared to the start of the year. The higher frac count can improve FTI’s topline in Q1 2023.
LNG Price Decreases
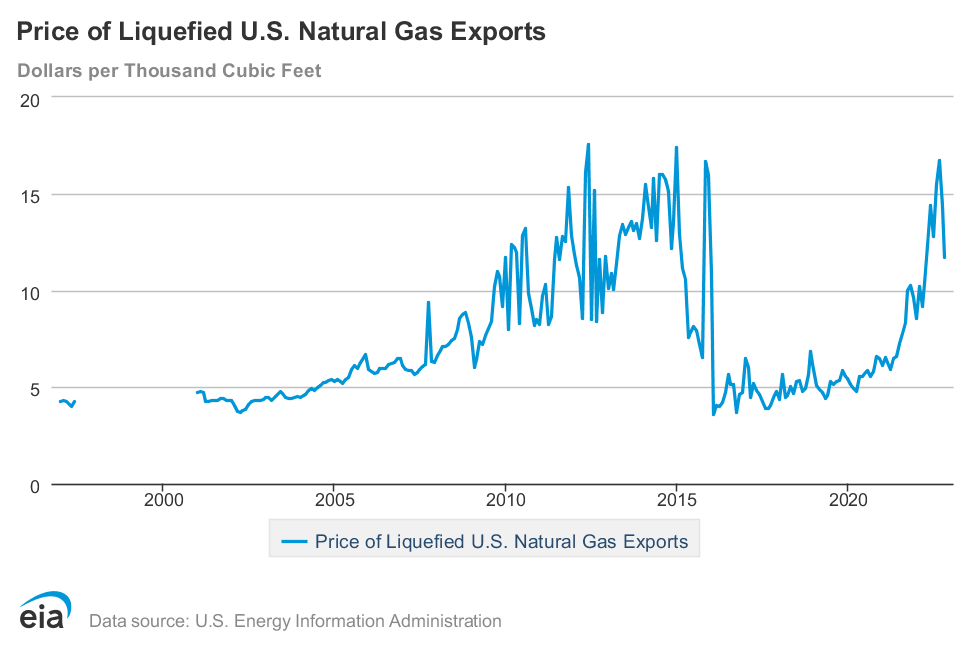
The US LNG export price was 18% lower than the previous month, although it increased by ~14% In the past year until November 2022. According to EIA, the US monthly storage inventories have exceeded the five-year average. According to its estimates, the US dry natural gas production in January remained nearly unchanged because mild weather reduced demand for space heating. In recent months, the utilization of liquefied natural gas (or LNG) export was also lower due to high natural gas stock levels in Europe. In 2023, however, the US LNG export is expected to rise after the Freeport facility returns online.
Subsea Segment: Performance
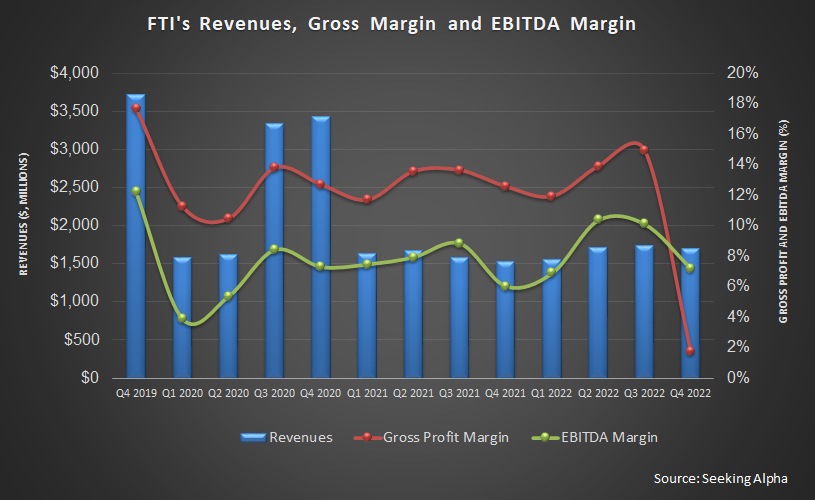
FTI’s Subsea segment revenue decreased by 5.2% in Q4 2022 compared to Q3. The segment’s operating income declined by 41% following a rise in installation activity. Following seasonal factors, lower vessel-based activity in various international geographies led to the deterioration in results. The saving grace in this segment in Q4 was the higher-than-one book-to-bill ratio (1.1x), which can improve results in 2023.
Surface Technologies Segment: Analyzing Recent Performance
Quarter-over-quarter, FTI’s Surface Technologies segment increased by 10.7% in Q4 2022, due primarily to the execution of the 10-year framework agreement with the Abu Dhabi National Oil Company (or ADNOC). Operating income recovered sharply, by 35%, following improved profitability in North America. However, the production ramp-up in the Middle East increased the cost structure. The US frac spread count has decreased by 6% in the past year, as estimated by Primary Vision.
Cash Flows and Balance Sheet
FTI’s cash flow from operations (or CFO) deteriorated in FY2022 compared to a year ago. The adverse effect of the timing differences on project milestones, the timing of income tax refunds, and vendor payments for inventory led to a steep fall in CFO. Although free cash flow declined compared to a year ago, it was positive and slightly improved in Q4. Revenues over the past year had minimal effect on the cash flows.
FTI’s debt-to-equity ratio (0.42x) is lower than its peers’ (SLB, BKR, HAL) average of 0.64x. As of December 31, 2022, its liquidity (cash plus investments plus availability of borrowings under the revolving credit facility) was $2.0 billion. In July 2022, it announced a $400 million share buyback program. By Q4, it had already repurchased $100 million, or 25% of the total program. The average purchase price was 25% below the current price level, which shows the management’s apparent lack of confidence in holding on to the current price.
Learn about FTI’s revenue and EBITDA estimates, relative valuation, and target price in Part 2 of the article.


