Business Model Transformation Effect
In our short article, we discussed our initial thoughts about TechnipFMC’s (FTI) Q1 2023 performance a few days ago. This article will dive deeper into the industry and its current outlook.
FTI has designed and developed an integrated commercial model. Beginning with the front-end engineering and design (or iFeed), it encompasses iEPCI (an optimized architecture and solution) for accelerated first production. It also involves the Subsea 2.0 product portfolio, which reduces complexity and cost. Using Subsea 2.0 shortened the subsea tree by more than 50%. In Q1, it delivered its first integrated project in Brazil. The company’s “configured to order” (or CTO) model increases the manufacturing capacity without additional capex by eliminating design engineering. With pre-approved suppliers, it reduces supply chain risk.
Further dealing in subsea management, FTI has created a pipelay vessel ecosystem through alliances with Allseas and Saipem. The collaboration among iEPCI, Subsea 2.0, and the vessel ecosystem has enhanced capital efficiency and differentiated FTI’s business model.
FTI’s Q2 Outlook
FTI expects the Subsea segment revenues to grow by 15% in Q2 2023 and the operating margin to expand by 400 basis points. The typical positive effect of seasonality in Q2 and a higher margin on backlog should lead to improved results. In Surface Technologies, better performance in international markets can keep revenues unchanged, while the EBITDA margin can expand by 50 basis points in Q2.
In FY2023, a $3.3 billion backlog is expected to support the Subsea performance. Combined with the Subsea Services inbound order, it should cover 90% coverage of its full-year revenue (at the guidance mid-point). Higher revenue should translate into higher cash flows. In Surface Technologies, the company expects the current momentum from the international markets to continue. You may read more about the company in our article here.
Inbound Order Growth
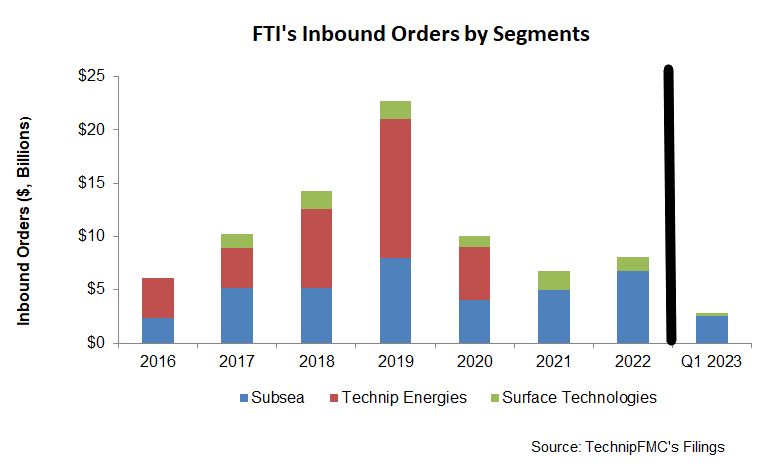
In Subsea, FTI’s inbound orders were $2.5 billion representing a book-to-bill of 1.8x. This includes four awards and a large iEPCI project in Q1. Investors may note that iEPCI accounted for more than 50% of orders, while combined with iEPCI Subsea services and Subsea 2.0, it totaled 70% of awards.
Given the strength of the broader market, the company’s management expects iEPCI inbound orders to exceed the Q1 total. In Q1, inbound orders in Surface Technologies were 0.32 billion. An increased level of iFEED activity at the iEPCI phase of the project supports the company’s expectation of more than $8 billion in Subsea orders in FY2023, which would be 19% higher than in FY2022.
Analyzing The Q1 Drivers
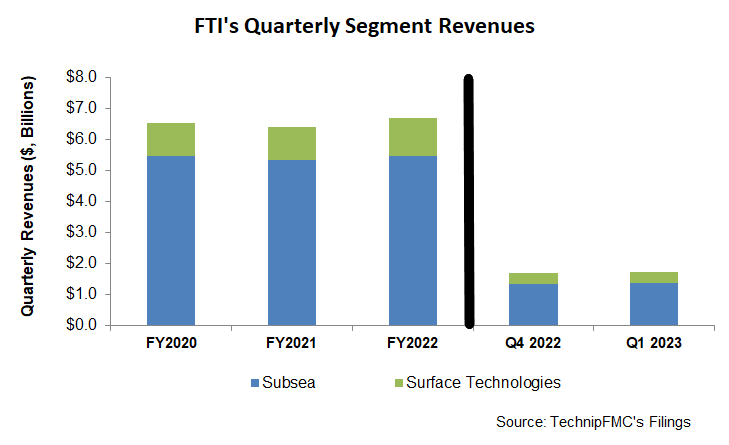
As discussed in our short article, the company’s Subsea segment saw a 3.4% quarter-over-quarter revenue rise in Q1 versus a 6.3% fall in revenues in the Surface Technologies segment. Higher project activity in Brazil and the Gulf of Mexico kept the Subsea revenues and EBITDA margin steady in Q1.
On the other hand, lower international activity and an adverse backlog conversion timing lowered the Surface Technologies segment revenues and EBITDA.
Capex And Leverage
FTI’s cash flows remained in negative territory and deteriorated further in Q1 2023 compared to a year ago, as I discussed in our short article. The free cash flow consumption (i.e., negative FCF) reflects typical seasonality led by higher working capital consumption. Adverse timing of project milestones and the payment of annual incentives increased the working capital requirements in Q1.
FTI’s liquidity was $1.47 billion as of March 31, 2023 (excluding working capital). Its debt-to-equity (0.43x) is much lower than its competitors (SLB, BKR, and HAL). During Q1, it repurchased 40% of its $400 million repurchase program. The management expects profitability improvement, and the effect of business transformation would support further share buyback in the future.
Relative Valuation
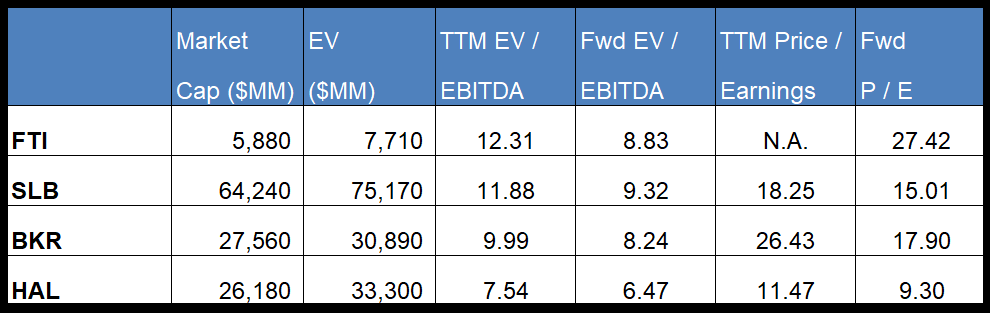
FTI is currently trading at an EV-to-adjusted EBITDA multiple of 12.3x. Based on sell-side analysts’ EBITDA estimates, the forward EV/EBITDA multiple is 8.8x. The current multiple is higher than its past five-year average EV/EBITDA multiple of 6.4x.
FTI’s forward EV-to-EBITDA multiple expansion versus the current EV/EBITDA is much steeper than peers because its EBITDA is expected to decrease more sharply than its peers in the next year. This typically results in a much lower EV/EBITDA multiple than its peers. However, the stock’s EV/EBITDA multiple is higher than its peers’ (SLB, BKR, and HAL) average. So, the stock is overvalued versus its peers.
Final Commentary
FTI’s advantage lies in the integrated commercial model, which combines iFeed, iEPCI, and Subsea 2.0, allowing it to participate from the initial design to project completion. The model increases the manufacturing capacity without additional capex and reduces supply chain risk. It has also added a pipelay vessel ecosystem to complement the integrated model. An increased level of iFEED activity at the iEPCI phase of the project supports ~$8 billion in Subsea orders in FY2023. Backed by the current momentum in offshore and robust backlog, FTI’s Subsea segment revenues and operating margins will likely grow in Q2. However, its Surface Technologies segment topline can stagnate.
However, the company’s cash flows remained in negative territory and deteriorated further in Q1 2023 due to the adverse timing of project milestones and the payment of annual incentives. The company has resorted to share buyback to improve shareholders’ returns. The stock is overvalued versus its peers.


