
The World Bank’s Global Economic Prospects (GEP) report for June 2024 presents a cautiously optimistic outlook for global growth, despite underlying challenges and risks. According to the report, global growth is projected to stabilize at 2.6% this year, holding steady for the first time in three years. This stabilization comes amid geopolitical tensions and high interest rates, with a slight uptick to 2.7% expected in 2025-26 due to modest improvements in trade and investment.
Inflation is forecasted to moderate but will do so more slowly than previously anticipated, averaging 3.5% in 2024. Central banks, both in advanced economies and emerging market and developing economies (EMDEs), are likely to remain cautious in easing monetary policies due to ongoing inflationary pressures. Consequently, benchmark policy interest rates are expected to stay about double the average of the 2000-2019 period.
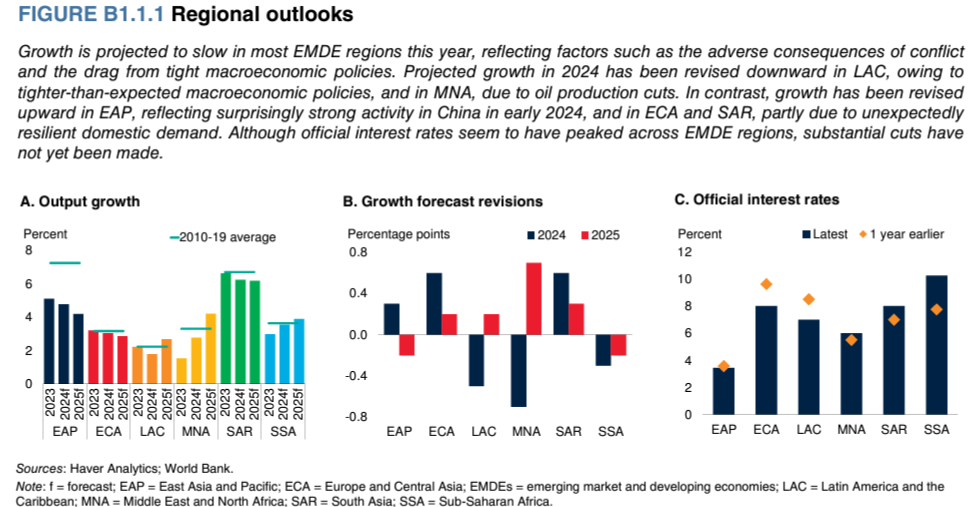
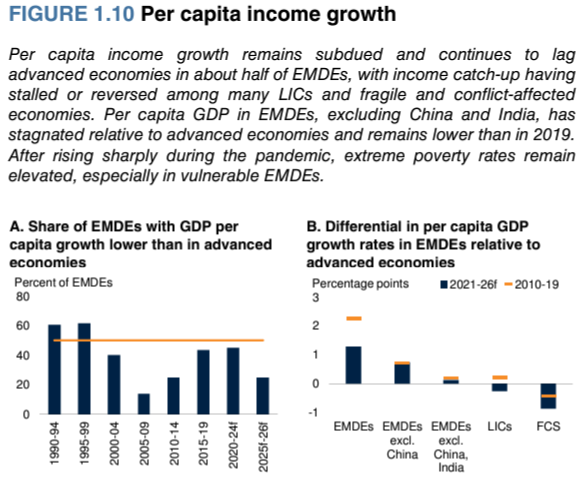
Despite these modest improvements, the global growth outlook remains subdued compared to historical standards. The report highlights that global growth over the forecast horizon will be nearly half a percentage point below the 2010-2019 average. Specifically, in 2024-25, growth is anticipated to underperform its 2010s average in nearly 60% of economies, representing more than 80% of the global population and world output. EMDE growth is expected to moderate from 4.2% in 2023 to 4% in both 2024 and 2025.
The GEP report underscores significant downside risks. Escalating geopolitical tensions could lead to volatile commodity prices, and further trade fragmentation could disrupt global trade networks. The persistence of inflation might delay monetary easing, and a prolonged period of high interest rates could dampen global economic activity. Additionally, major economies might face slower growth due to various domestic challenges, and climate change-related natural disasters could further hinder economic activities.

To address these challenges, the report calls for decisive global and national policy efforts. At the global level, priorities include safeguarding trade, supporting green and digital transitions, delivering debt relief, and improving food security. At the national level, EMDEs need to focus on maintaining price stability amidst persistent inflation risks. High debt levels and elevated debt-servicing costs necessitate policies that boost investment sustainably while ensuring fiscal stability. Structural reforms are essential to raise productivity, improve public investment efficiency, build human capital, and close gender gaps in the labor market.
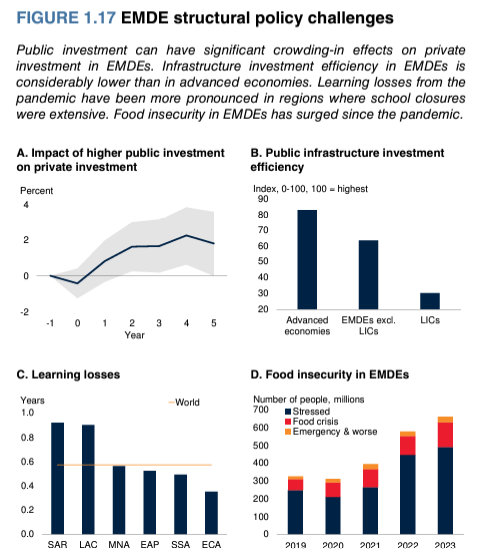
The report emphasizes the critical role of public investment in driving growth in EMDEs, particularly through catalyzing private investment and boosting productivity. However, public investment has significantly slowed over the past decade. EMDEs with ample fiscal space and a history of efficient government spending could see substantial benefits from scaling up public investment. To maximize these benefits, policy reforms are needed to improve public investment efficiency and create fiscal space through revenue and expenditure measures. The global community can support these efforts through financial assistance and technical support, especially in lower-income developing countries.
Copper Market Dynamics
The copper market has experienced significant volatility recently, influenced by tight supply from mines and speculative trading. Between February and June, copper prices surged due to supply constraints and fears of a worsening global deficit. The rise was further fueled by speculative traders and the AI trade, pushing prices to new heights. However, in recent weeks, prices have fallen, breaching a critical trend line, with copper on the London Metal Exchange dropping to $9,652 per ton, an 11.5% decrease from its May high of $11,104 per ton.
Goldman’s James McGeoch indicated that the speculative frenzy was driven by various factors, including AI narratives and financial FOMO (fear of missing out), with consumers stepping back as prices soared above $9,000 per ton. He suggested that the price range might adjust higher by about $1,500, with projections for the low end of the range to be settled in the coming weeks, and the high end potentially reaching between $10,000 to $11,000.
Hedge funds like Rokos Capital Management and Andurand Capital Management have made significant bets on copper, predicting prices could reach $20,000 or more. Andurand Capital, which saw gains of 13% to 30% in April due to bullish copper bets, believes that the recent price increases are just the beginning of a long-term bull market driven by increasing demand from the energy transition and underinvestment in mine expansion. They foresee copper facing a decade-long supply deficit.
There are also important developments in the oil markets, but it merits a separate discussion therefore we will discuss those dynamics in the next installment of Monday Macro View – until then….Happy Reading!


