The energy markets have been in a free fall as economic uncertainty gained the upper hand against the geopolitical theater heating up. Brent has fallen below the range we’ve laid out of $77-$83, but I think we will see a move back above $77 and likely back to $80 before there’s a bigger pullback. The market is finally starting to weigh in on a weak economic backdrop and slowing demand. Our base case was for OPEC+ to keep the production cuts through at least 2024 with a likely extension into Q1’25. “At the August 1, 2024 OPEC+ meeting, the joint ministerial monitoring committee (JMMC) decided to keep their oil output policy unchanged. However, ministers emphasized their capacity to alter production plans at will. This flexibility means that OPEC+ can pause or reverse these cuts based on prevailing market conditions, keeping the market on edge as future production levels remain contingent on OPEC+’s decisions.”[1] While crude is kept off the market, countries can try to compete through OSPs or official selling prices. KSA delivered a very expected increase in Asia OSPs and a drop into Europe. This will cause more price cuts from WAF as they struggle to clear their crude slates into Asia. China has reduced Angola purchases, which pushes a lot of that crude into the European markets. Tanker rates have remained depressed in the ME and Med amid lower chartering activity.

We should start to see a bit more activity out of the European refiners, but there is still a lot of crude competing in the Atlantic Basin. Crude futures always overshoot to the upside and downside, and this is no different when you look at DFL and other physical prints. “Physical market slowly giving in, albeit contract roll next week. Given the magnitude of the sell off, DFL still positive, structure still backwardation… traders are banking on an OSP price increase to Asia from Aramco to turn this around… very well could be.”[2] KSA delivered what the market was expecting with an increase in Asian pricing based on the shift in the chart below.

There are additional shifts when you look at the Dubai-Brent EFS failing to widen as Asian buyers locked up most of their allocations. The shift in the market from Asia to Europe (based on KSA OSPs) will shift the market a bit, but the one to watch will be WAF flows.
Before we get into WAF, it’s important to see another level of oversupply in the Latin American market. There are 5Mb (2 VLCCs) of Brazilian Tupi for October delivery in Asia that remain unsold, until they find a new home those cargoes will pressure the Atlantic. I don’t think the market appreciates the amount of crude that is sloshing around the water between floating storage, planned loadings, and crude in transit.
WAF pricing fell enough to pull in some additional buyers from China, but U.S flows continue to crowd out Europe from buying additional WAF cargoes. “WAF: Congolese Djeno crude was selling fast, with China’s Unipec purchasing several cargoes in the previous week, or up to half of the September export plan. Offers for the heavy sweet grade stood at around Dated Brent minus $1 a barrel. India’s HPCL purchased Angolan Pazflor and Ghanaian Jubilee, spurning Nigerian grades. Offers for Qua Iboe and Bonny Light dipped by around 30 cents to below Dated Brent plus $3 a barrel, with U.S. barrels crowding them out in Europe.”
Angola cargoes being preferred have kept Nigerian barrels stuck on the coast, which will keep prices capped in the region. We are already seeing it in the pricing structures: WAF: Angolan state oil firm Sonangol has sold a cargo of Girassol crude and trimmed its offers of three other September-loading cargoes. Offers of Nigerian grades were also heard to be coming down earlier this week, reflecting soft demand. Sonangol offered Dalia at Dated Brent flat, Gimboa at Dated Brent minus $1 and Kissanje at Dated Brent plus 80 cents, Girassol at Dated Brent plus $3.30. The North Sea saw cargoes sold at some premiums, but it was weaker than previous sales as more competition heats up in the market. The U.S. is sending a bunch of vessels into the region, which will help keep prices capped as well.
The paper markets remain fairly fixed in the current setup, which helps shift the Brent markets back to $80.

The loadings have picked up in some areas even as demand has stayed relatively muted. Chinese imports have remained muted in July, but we expect to see this accelerate in August as pricing improved for buyers. It won’t change enough to see pricing move further above $80, but it will be enough to keep us range bound.
The new estimates are coming out a bit tighter: “EIA projects a deficit a deficit of 0.58mbpd (was a deficit of 0.48) in 2024 and a deficit of 0.10mbpd (was a deficit of 0.08mbpd) for 2025.” This backdrop will keep the market in it’s current range, but I don’t see anything out there that will drive us above the $83 ceiling in Brent. Prices at these levels have led to another bump across inflation that will keep the consumer on the sidelines.
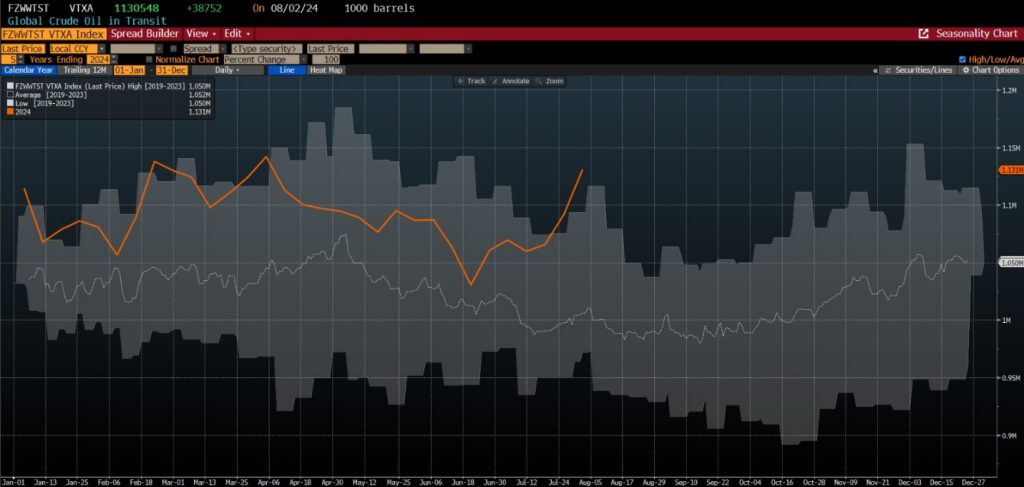
Here’s another look from OilX showing global crude oil stocks, and how they’ve declined throughout the summer. Seasonally speaking, the summer is a normal drawdown period, and the question pivots to “how much crude is in transit?” There still remains a significant amount driven by Russian volumes, and others “slow steaming” to get to their locations. China has been very slow in their purchases to help balance their storage levels, which isn’t truly reflected in the builds below. Instead, we are seeing some of the drawdowns driven by the huge increase in storage.

The market loves to focus purely on crude in onshore and offshore storage, but forget that there is a huge amount of crude “in-transit.” When we look on the water, we can see that a huge amount has been set in motion. This will show up on the shores of Europe and Asia and is the biggest overhang for physical pricing. The fact it’s setting a new seasonal record is the most overlooked level as we head into the shoulder season.
There is currently a bounce in the Brent prompt spread, which is supported by some of the premiums mentioned early in the North Sea. But, the premiums have weakened which will keep some of this bounce capped. North Sea: Selling pressures Forties. Total offered Forties Aug 20-24 cargo at Dated Brent minus 28 cents on a FOB basis. Also Glencore offered Forties Aug 28-30 cargo at Dated plus 40 cents FOB. Shell offered Forties Sept 4-6 cargo at Dated plus 40 cents FOB.

The U.S. EIA data showed a strong draw with a large part of that driven by a pick-up in exports, which will slow down as we head through the rest of August. We sent a huge contingent of tankers to Europe in the end of July/ Beginning of August driven by an open arb into the region. This has closed as WAF dropped pricing, and now we have KSA shifting OSPs lower into the region. The exports drove a sizeable drop in PADD3, but we expect to see that bounce higher as we head throughout the rest of August. As the XOM facility comes back online in PADD2, we will see a small bounce in utilization rates (refinery runs) and some additional pull through from PADD2 as PADD3 flips to builds.

We also have an increase in imports coming into PADD3 following some sizeable drops in imports recently.

When we flip to the demand side, the issue remains slow consumption on the gasoline side as distillate overhangs persist. We’ve seen a steady summary that has struggled to maintain anything over 9M barrels a day. We should get a bit of a spike this week as this is a big week for vacations before kids start going back to school next week. Distillate demand is struggling around the world, which has resulted in builds around the world.

The last two years saw distillate storage fall to record lows and created a huge spike in crack spreads. This has backed off considerably this year as refiners caught up with volumes and demand slowed around the world. As exports struggle and demand stays sluggish, we expect to see builds in the U.S.- especially in PADD 3 that is now closing in on the 5 year running average.

Gasoline saw a counter seasonal build, but we should expect a draw next week driven by the direction of blending components. The drawdown this year has been disappointing during “peak” summer driving, and it doesn’t bode well for the shoulder season. Imports were large the last few weeks, and we are starting to see some of that slowdown in the near term. The arb is still open from Europe, but the availability of vessels has caused a small departure from deliveries. We see this accelerating into the end of August.

Exports of crude and distillate will slow as we head throughout August. Gasoil from the ME continues to flow into the Atlantic Basin, which will push down what we are exporting. This will result in even bigger builds of disty in PADD 3. Crude exports had a nice bounce throughout the last week of July and first week of August, but there will be headwinds throughout August and so far into September on flows. This should keep us closer to a running average of 3.8M barrels a day of exports.

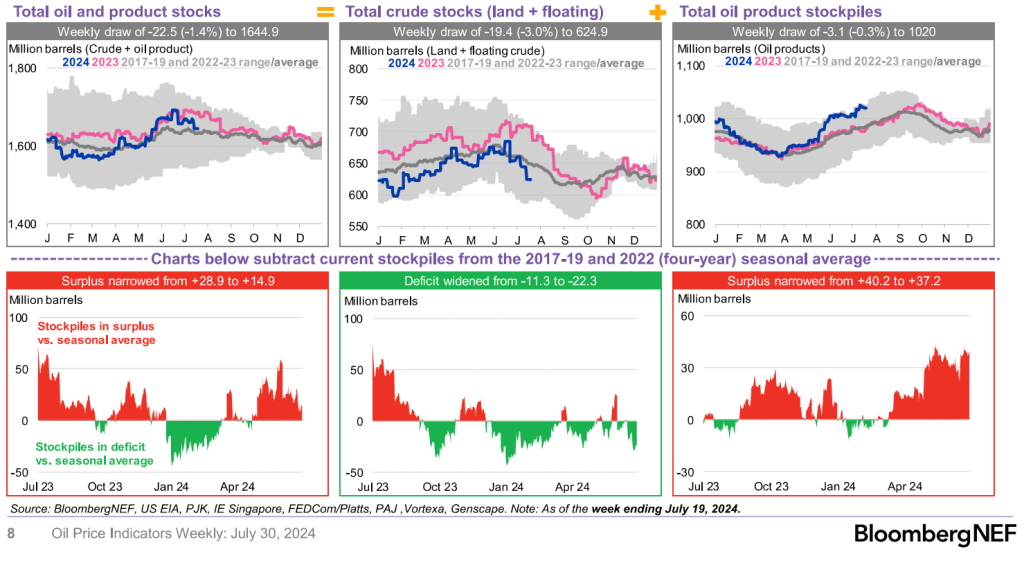
On a global basis, we’ve seen crude stocks move below the seasonal average driven by more volume being moved into transit. The oil product story continues to tell you where refinery runs are heading given weak demand as we come to the end of the peak season.
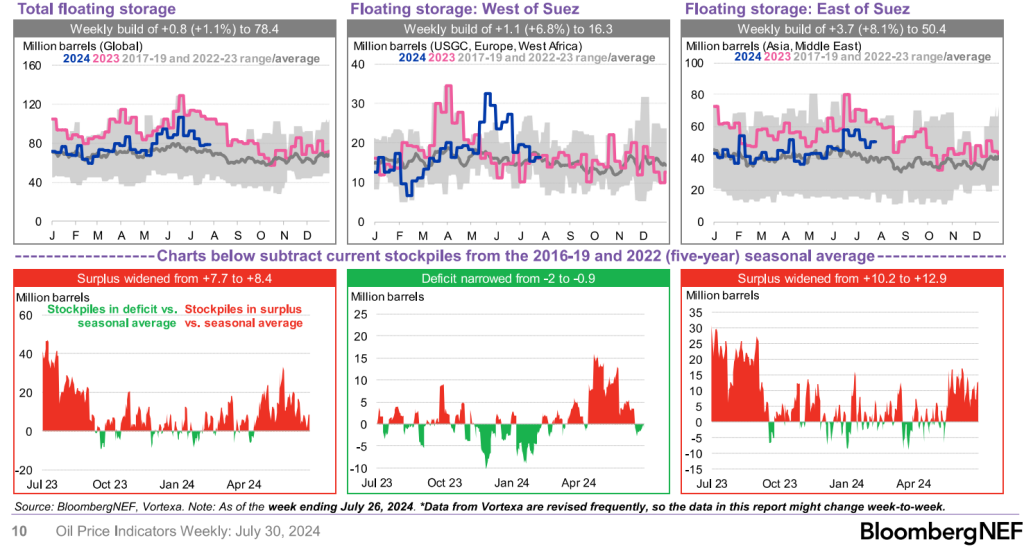
The drop in floating storage is driven by cargoes being reclassified as “in-transit”, which shows a drop in WAF (West Suez) and will show up in Asia and Europe. There are currently 11 Angolan and 7 Nigerian cargoes unsold, and we will see China moving to the ME for supplies in August and Sept. This will keep WAF prices under pressure and leave more crude in the water.
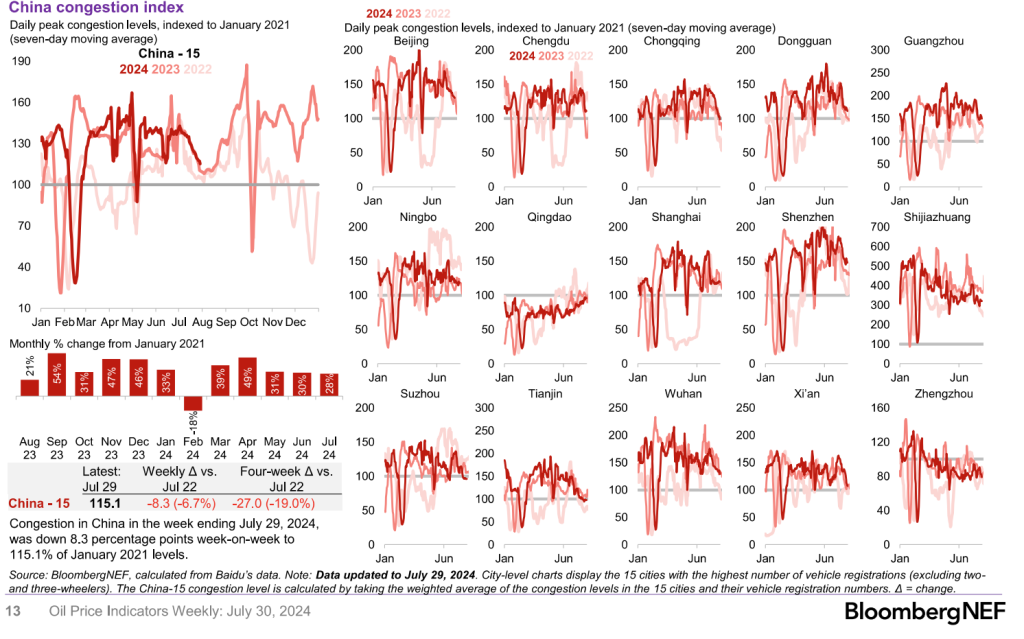
China has continued to see a decline in travel close to the seasonal average from last year. I was expecting a bit stronger demand, but it will be key to see how the populace travels during the Sept holiday. You can see a huge spike, but I expect to see a big increase- just below what we saw in 2023.
There was only a small reprieve in China refinery run rates, but they still remain FAR below the seasonal averages. State-owned and private assets are still operating far below average, which will keep purchases of crude mutes. I still expect a more active August vs July, but that is just driven by how bad the imports were in July.

The crude markets will remain range bound as some flat pricing supports spreads, and OPEC+ stays the course over the rest of the year. Demand will continue to keep the upside capped even as geopolitical pressures mount waiting for an Iranian response. Refined product crack spreads have improved over the last 2 weeks, but we don’t see any additional increases. As we progress through August, we believe that crack spreads will drift lower and likely push refiners to start turnarounds slightly ahead of schedule. Refinery run rates have already been disappointing this summer, and we don’t see that changing in the shoulder season. Refined product storage is elevated around the world, which will keep prices capped to the upside in the crude markets.
The geopolitical issues remain at the forefront of the issues with more pressure coming in the next 10-14 days. Crude prices responded today (Aug 7th) to reports that Iran closed its air space to commercial traffic. They haven’t responded to the assassination of Ismal Haniyeh, and from all back-channel indications- it will be a “measured” response. Israel has prepared for an offensive into Lebanon to tackle to Hezbelloh element along the border. The U.S. has also moved assets into the region and additional squadrons to allied airbases throughout the region. Jordan and KSA have also stated that their airspace is closed for missiles, drones, and aircraft targeting Israel and anything enter it unauthorized will be shot down. Israel has pre-emptively struck areas in Lebanon and Syria targeting additional strategic personnel and supply convoys.
Important geopolitical events last 3 months (May 2024 → August 1 2024)
May 6, 2024: Rafa offensive
- Crude prices 5/6/24: $82.98
- Crude prices 5/9/24: $83.78
May 31, 2024: US and UK strike Houthi targets in Yemen after surge in shipping attacks
- Crude prices 5/31/24: $81.78
- Crude prices 6/3/24: $81.19
June 3, 2024: Israel killed IRGC commander Saeed Abiyar in an airstrike in Syria
- Crude prices 6/3/24: $81.19
- Crude prices 6/6/24: $78.58
June 19, 2024: Israel approved offensive battle plans in Lebanon to fight Hezbollah
- Crude prices 6/18/24: $84.40
- Crude prices: 6/21/24: $85.68
July 4, 2024: Hezbollah attacked Israel
- Crude prices 7/5/24: $87.03
- Crude prices 7/8/24: $86.75
July 13, 2024: Israel killed Mohammed Deif (Hamas) in Al Mawasi airstrike
- Crude prices 7/12/24: $85.59
- Crude prices 7/15/24: $85.03
July 19,2024: Houthis launch a drop that struck Tel Avivi and killed an Israeli man
July 20, 2024: Israel struck Hodeidah port in Yemen in response
July 27, 2024: A rocket fired by Hezbollah strikes a soccer field in the Golan Heights killing 12
July 28, 2024: Venezuelan presidential election; Maduro clinging to power sparked protests
- Crude prices 7/29/24: $81.02
- Crude prices 8/1/24: $81.51
July 30, 2024: Israel killed senior Hezbollah commander Fuad Shukr in an airstrike in Lebanon
- Crude prices 7/30/24: $79.84
- Crude prices 8/2/24: $80.04
July 31, 2024: Israel killed Ismail Haniyeh (Hamas) in Tehran
- Crude prices 7/31/24: $79.06
- Crude prices: 8/5/24: $77.44
There is likely going to be a much bigger response in Lebanon over the coming days driven by the rocket hitting a soccer field. Israel killed a key Hezbollah asset in Beirut, and there will likely be a ground attack along the border to clear out hidden sites. The Israel air force hit several launching sites in response, and it also acted as a pre-emptive attack to mitigate capabilities ahead of an Iranian response.
In Libya, we have another shutdown of the Sharara field taking about 300k barrels a day offline. It was shut down by local protestors: “Libya’s NOC declares Force Majeure for Sharara oil field, closed by protest action since weekend. (Sharara is Libya’s biggest oil field, production about 270,000 b/d. Shutdown brings overall national production down to approx 930,000b/d).” There looks to be a lot of political back and forth with the Libyan oil minister, Khalifa Al-Sadig was arrested and Haftar’s son arrested in Naples related to the Spanish allegations. “The head of the Fezzan movement, a local protest group that has previously shut down the oilfield, insisted it had nothing to do with the shutdown attempt. “Saddam Haftar gave immediate instructions by telephone and without the use of military force to shut down the site in response to the attempt to arrest him last Friday in Italy, on the basis of an arrest warrant issued against him in Spain,” said Bashir al-Sheikh. “I have nothing to do with the closure of the field and I refuse to be accused of this.” The Barcelona-based newspaper Crónica Global has reported that the warrant was issued over the seizure by Spanish police a year ago of military equipment and weapons destined for the United Arab Emirates but allegedly intended to be diverted to eastern Libya.”[4]
The shut down of the Libyan field will likely be short lived, but it shows that there will always be political uncertainty in the region.
There have been some crude permabulls discussing Israel plans to strike oil producing assets in Iran, and I can say- without a shadow of a doubt- this will NEVER happen. Everyone recognizes that if and when a regime change happens the assets will be paramount for the new government’s success. Also, any attack on oil fields would provide some form of unity of the populace blaming Israel. Instead, strategic attacks will be key because many of the entities Israel and the U.S. are terminating have killed just as many (if not more) Iranian citizens than U.S. or Israeli citizens and soldiers.
The market gives Russia and Iran more credit than they deserve when it comes to geopolitical strength. Russia is stretched thin with assets bogged down in Ukraine, Syria, and Africa, while Iran has taken losses in Syria and other proxy locations. Typically, Iran’s IRGC Qud force and Russia’s Wagners maintain a meaningful presence in Venezuela. But, over the last 12+ months they’ve been shifting assets out of the region. The Wagners have taken heavy losses in Mali and Niger with a recent attack in Mali killing 70 soldiers with early reports saying Anton Yelizarov was also killed. This was later retracted saying he survived, but there still hasn’t been confirmation in either direction.
Ukraine has taken some heavy losses in the south, but have made progress pushing into Russia on the eastern front. The move onto Russian soil will create more problems for the Kremlin and distracted them from the outcome of the VZ election.
The IRGC have also been shifting assets out of VZ, and Maduro has made promises that everything was going to be fine during the election. The Wagners helped him stay in power after the last election, but this loss was sweeping even with the massive voter fraud. There have been attempts to crack down on the dissenters, but the movement is massive, and it will likely result in Maduro losing power in Venezuela. The opposition party has found support throughout Latin America, and they will likely gain more support over the coming weeks.
Russia has sent a “training” military ship to VZ, and Cuban special forces have started to arrive. So far, several of Maduro’s key gangs and national guard units have switched sides. This will weigh on their ability to maintain control. A shift in political parties would be a great setup for U.S. and Western crude exports. It would allow for U.S. E&P companies to re-enter the country and repair their crude production. The U.S. is running tight on heavy crude, so additional VZ crude would be a welcome reprieve. It would also relieve the risk that the VZ military will move on Guyana and open up more volume into the global crude markets. This is all developing, and this isn’t something that will happen before the end of the year.
Iran is targeting an expansion of crude output with some of it already happening and flowing into China. It was heading to India, but those volumes have slowed following altercations between Indian and Houthi assets. Some of this volume will continue coming to market, but we don’t expect the full amount given the limitation on equipment and personnel.

It will be enough to offset some of the slowdown from the OPEC+ nations, and we continue to see more crude in transit.
Geopolitics remains fluid at the moment, but I think in the long term we are going to see sizeable pivots on the political theater. These shifts should be a positive for crude flows making more volumes available to the world- especially the U.S.
The economic data continues to flip around, but the most important set is the shift in the carry-trade. In simple terms, investors would short yen at very cheap rates and use those proceeds to buy USD to deploy into stocks and Treasuries. The shift in Yen inflation as more currency was shorted (pushed into the market) sent the Nikkei to the stratosphere. When inflation runs, the stock market equities will rise to accommodate those extremes. There was also a carry trade where a trader would short yen and JGB to purchase USD and TSYs.
I laid out in Oct ’22 how this would all unfold, and my view was that everything would hold until the BoJ was forced to raise rates. My view was they would try YCC (Yield Curve Control) followed by direct Yen intervention before they were forced to abandon both and raise rates. The catalyst was the BoJ raising rates to .25%… yes you read that right… .25%!!!!!!!!! This is all it took to make people panic and start the unwind of the first leg of the carry trade.
My old boss had a saying “too much, too fast” because you have forced selling, liquidation forced from risk managers, margin calls, and a gamma squeeze lower. Once this all settles, there is typically a sharp rally higher, but it’s usually on razor thin volume. The bigger issue now are the different sides the Fed and BoJ find themselves. If the Fed cuts rates, it will hurt the carry and force additional liquidation of the carry trade. If the BoJ raises and the Fed cuts, it will just accelerate it. BoJ governors were attempting damage control saying no additional raises would happen in this kind of volatility, so the market got to work challenging that view. It sent the Yen screaming higher, and it will force the BoJ to eat those words.
It’s important to appreciate the sheer size of what has been developed over the last 6+ years with the carry trade. The COVID shift only accelerated what has been developing over the last decade.
- $20 trillion, or 505% of Japanese GDP, using its government balance sheet, according to Deutsche bank
- $3.4 trillion (487T yen) based on Japanese investors’ net international investment
- $1 trillion using Japanese banks’ foreign lending data
When we pivot to another metric, you can see just the sheer level of the carry trade looking even further out. According to Bloomberg Economics’ Taro Kimura analysis the Japanese Yen short positions last week hit the highest level in HISTORY. Yen short positions are used as a proxy to assess the carry trade volume, and they recently even exceeded before 2007 crisis levels

The last look I’ll share on the BoJ exposure is the below breakdown of their balance sheet as a percentage of GDP. Why the BOJ has no choice and is merely prolonging the inevitable: “at a gross balance sheet value of around 500% GDP or $20 trillion, the Japanese government’s balance sheet is, simply put, one giant carry trade.” – Deutche Bank

The above data gives color to the level of exposure the BoJ has and some of the things that can be liquidated.
The drop in the markets came when the BoJ ONLY increased their interest rate to .25%. So a move from 0% to .25% was enough to send the market into overdrive. It’s important to understand the mechanics of what’s to come. The BoJ put their neutral rate (the long-term expectation of their rate policy at 1%-1.25%, but quickly added color to it saying- they would avoid additional rate hikes in this kind of volatility. The “backtrack” didn’t do much to comfort the market because the slide has begun, and it will be impossible to stop.

The BoJ decided to intervene to try to stop the slide, but the intervention and commentary only had a very muted bounce.

The BoJ is being forced to raise rates to strength the Yen while the U.S. Fed is going to be in a position of cutting over the next 12 months. I don’t believe we get a cut before November, but we will likely see something either in Dec or early next year. Essentially, we have the BoJ on pace to raise rates by 1% while the Fed cuts 2% over 2025. If the market reacted to a .25% swing like this- what will a 3% swing do to the carry-trade?
The U.S. equity market and Treasuries are very exposed to the swings that are about to come over the next few months- only made worse by a huge increase in TSY issuance by the U.S. I thought this was a great summary of where we sit:
- If Fed cuts aggressively here, JPY goes to 120 and every CUSIP has a flash crash, as the carry trade blows up. I
- If Fed cuts slowly, then it may just blow everything up anyway, cause the economy is rolling over and the ‘wealth effect’ was the only thing holding it up.
- Meanwhile, we just had a 10-yr auction and 30-yr auction that was VERY weak.
- There is a significant amount of new treasuries coming to market that will put addititional pressure on yields.
- So if the Fed cuts at all, they blow up the bond market and the banking sector. They realistically need to raise rates aggressively here to save things (imagine that!!).
- This is becoming the Emerging Market vs Developed Market dilemma. There’s been a re-acceleration of inflation around the world, which should keep rates elevated.
- The EM dilemma: the U.S. 10-yr sets the rate for a huge part of the global bond market, and the trend is going to be higher. This will put significant pressure on EM debt, and push their rates higher when they issue new debt.
When we look at the recent 10-yr and 30-yr auction we saw some very weak numbers. The problem is shifting in the market rapidly as foreign buyers disappear, and the market grows concerned about the debt being issued by the Treasury.
Ugly 30y UST auction, the worst since November ’23, tailing the When Issue (WI) by 3.1bp at 4.314%
- Primary dealer: 19.2% the highest since Nov ’23 and 2nd highest since Dec ’21
- Bid-to-cover: 2.31 the 2nd lowest since Nov ’23
- Direct Bidders: 15.5% the lowest since Feb
- Indirect Bidders: 65.3% slightly below the 6-auction avg
Bad10y UST auction: 3.1bp tail (same as April), biggest since Dec ’22.
- HY: 3.96%
- Bid-to-cover: 2.32, lowest since Dec ’22
- Indirect bids: 66.17%, slightly below 6-auc avg
- Direct bids: 15.95%, slightly below 6-auc avg
- Primary dealer take: 17.88%, highest since April
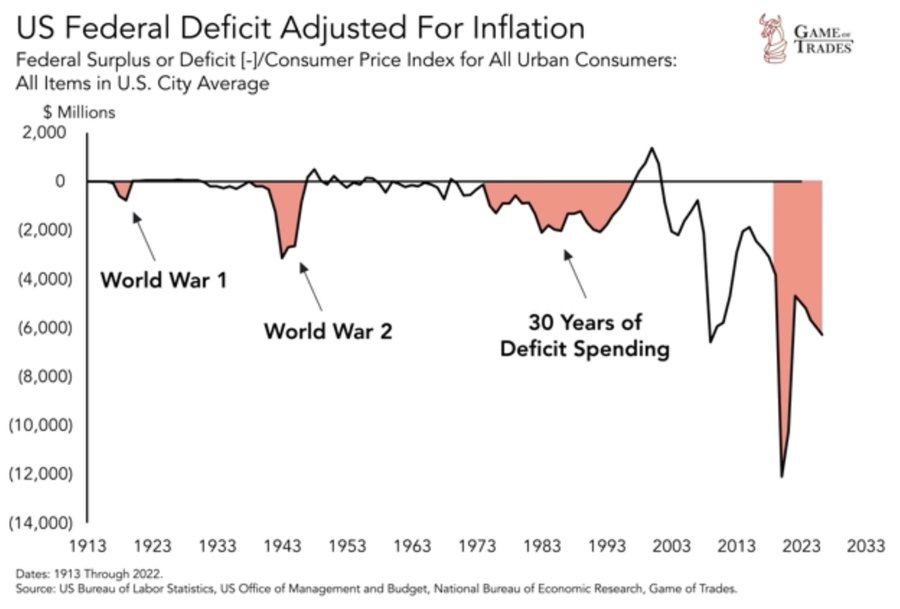
The U.S. deficit continues to grow rapidly with some quick data and chart on the rapid expansion:
- Inflation-adjusted US government spending in less than 4 years now exceeds the combined spending of:
- World War I
- World War II
- 1970 to 1990
- This is very concerning for the long-term health of the economy Everyone, except the US government, seems to understand this
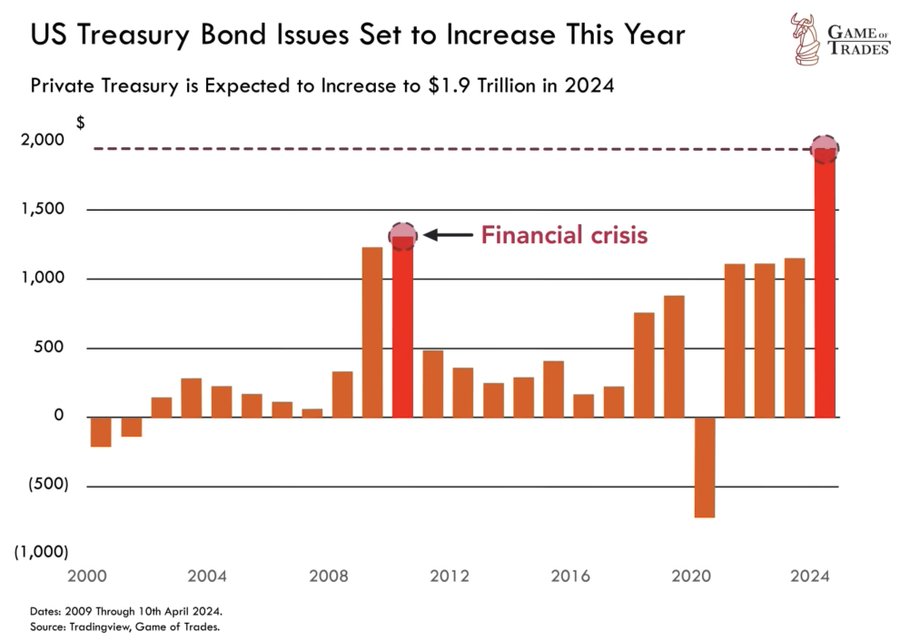
This level of spending requires a huge surge in bond issuance as you can see below:
- Treasury bond issuance in 2024 is expected to hit $1.9 TRILLION
- Surpassing levels seen even during the 2008 financial crisis
Yellen has also been shortening the duration of the bonds, which means she is increasing the auction sizes of 1 month notes- 2yr Treasury Bonds. This means the government’s “maturity wall” keeps getting shorter so we have to roll MORE debt MORE often at higher rates and larger quantities to cover spending and accrued interest expense.
As the carry trade unwinds, there will be a significant amount of U.S. TSY bonds and notes coming for sale as the treasury is forced to issue more paper. Our biggest buyers at the auctions have been foreign and macro investors taking advantage of the carry trade. With this gone, our biggest buyers disappear while they also liquidate their positions.
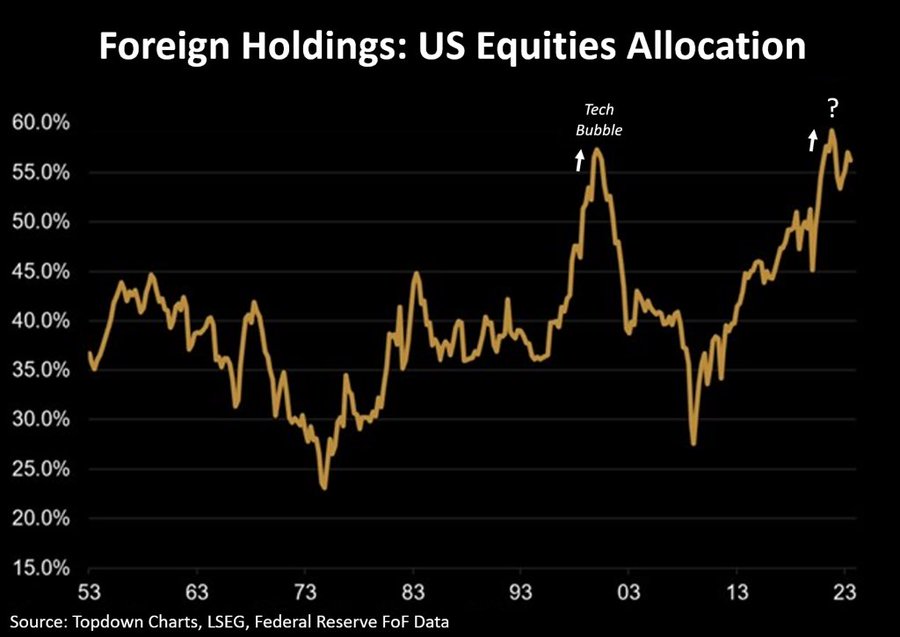
Our equity market is also stuck with a HUGE level of foreign holders. The below chart puts into perspective the amount of stock positions that are exposed to a carry trade unwind. “Every few decades, we experience a cyclical shift where investors transition from overweighting US equities to reallocating more capital to other regions, and this trend continuously reverses. Often, investors overlook these crucial moments when capital begins to shift dramatically, but it appears we are currently experiencing one of these significant turning points. Foreign investors, in particular, have reached a saturation point in US equities, resulting in some of the most extreme valuation disparities compared to businesses in other parts of the world.”[5] I think the quote from Otavio Costa is spot on in terms of the saturation point and the exposure in the public markets.
There’s a view in the markets that all the Fed needs to do is cut to save us all from interest rates. The problem is- the Fed Funds Rate just sets the overnight rate, but the market dictates where the yield curve is priced. We have seen forays into “Yield Curve Control” that have ended poorly, so a cut in the Fed Fund Rate might have a moderate effect- but it would reverse RAPIDLY driven by massive supply and limited demand. So the view that the “Fed controls rates” is purely a narrative that isn’t true in the slightest.
The market is also pushing HARD for a Fed cut in September, but all of the indicators show an acceleration in inflation and very limited restrictions in the bonds market.
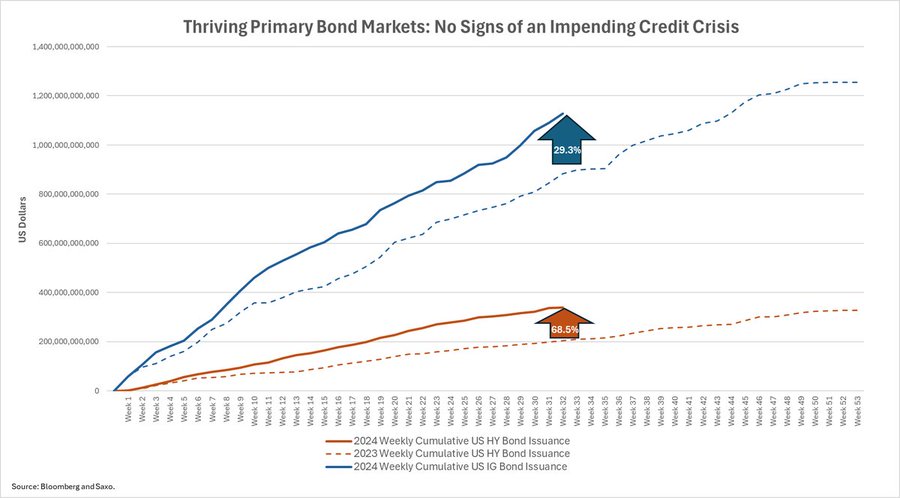
- Bond issuance bonanza suggests we’re far from a crisis:
- YTD US HY and IG issuance up 68% and 29% vs. the same period last year
- Investors find value in lowest yields in two years Companies borrow at highest funding costs since GFC
Essentially, banks are still lending to the market at comfortable rates with only moderate tightness in terms and approvals. This is NOT a market that is showing a credit crunch or requiring additional support/liquidity from the Fed. Inflation and current high yield bonds are showing that the Fed should stay the course. It will also help maintain a moderate unwind of the carry trade because a cut of the Fed Fund Rate would accelerate the selling pressure.
Americans are also continuing to add to their credit card debt levels. We hit a new all-time high of $1.4T in credit card debt!
- Americans owe $1.14 trillion on credit cards, averaging $6,329 per person, according to the Federal Reserve Bank of New York and TransUnion.
- Credit card delinquencies have risen to 9.1%. Balances dropped during the pandemic but surged 48% since early 2021 due to increased spending and inflation.
- Michele Raneri of TransUnion warns that people are maxing out their cards. Source: CNBC
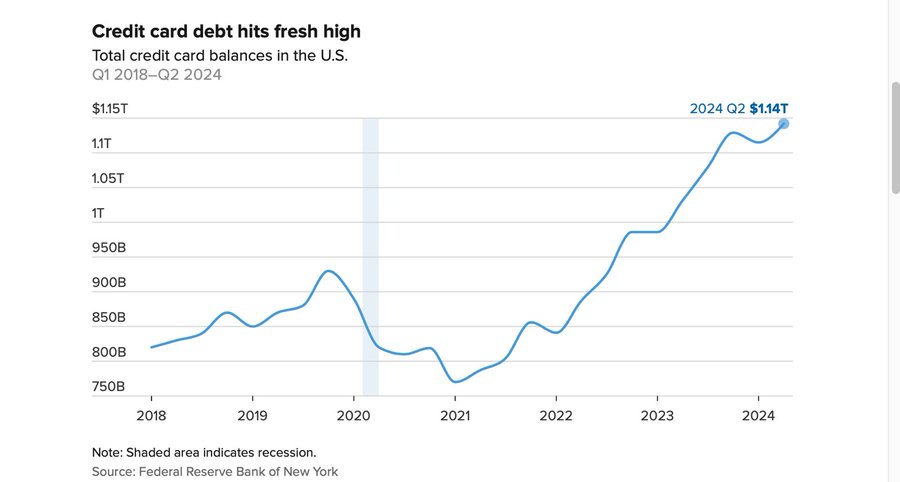
I have said time and time again that the “excess savings” number in the U.S. was grossly overstated. If you had all this extra money in savings, why would you borrow against your credit card at 20%+ that accrues every month? The consumer has been under pressure and foolishly still spending hoping for the “Fed Put” or some sort of bail out. The Personal Savings Rate in the US has moved down to 3.4%, the lowest since 2022. The average over the last 30 years is 5.8% with persistent inflation and spending taking its toll.

Here’s another chart showing the pressure point for 90+ delinquent rates:
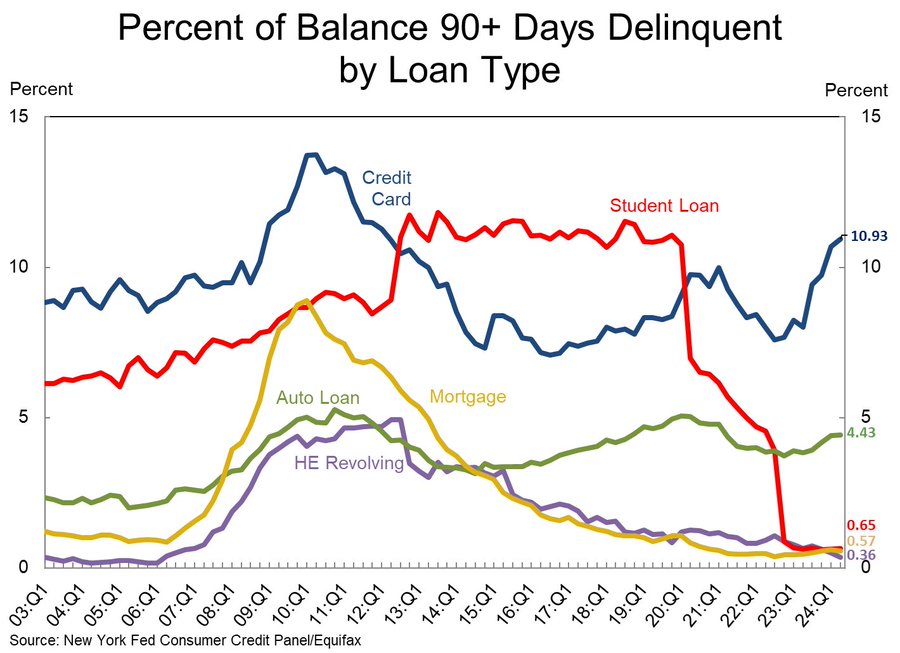
The mortgage delinquency is a bit misleading because it doesn’t show the issues in the “lowest quality” borrowers. When we look at FHA housing mortgage delinquencies, it becomes apparent the problems that exist in the market. The FHA delinquencies are at the second worst in history- worse than the Great Financial Crisis.

When we look at some of the important leading indicators of stress: Credit Cards and Auto Loans- you can see the pain coming to the consumer. “US households’ transitions into credit delinquencies continue to rise for both credit card and auto debt, with particularly sharp increases among younger Americans.”

Even with the recent selloff, it doesn’t justify the market’s expectations of a Fed cut in September- especially a 50bps one.
- Credit spreads for both high yield and investment grade corporate bonds remain tight by historical standards
- Inflation is accelerating across the board
- Consumers are still spending and leveraging their credit cards

AirBnB also signaled more pressure with a big earnings miss driven by lower occupancy rates and at lower prices. This is another signal that things are starting to slow down, but the biggest mistake would be a Fed rate cut.
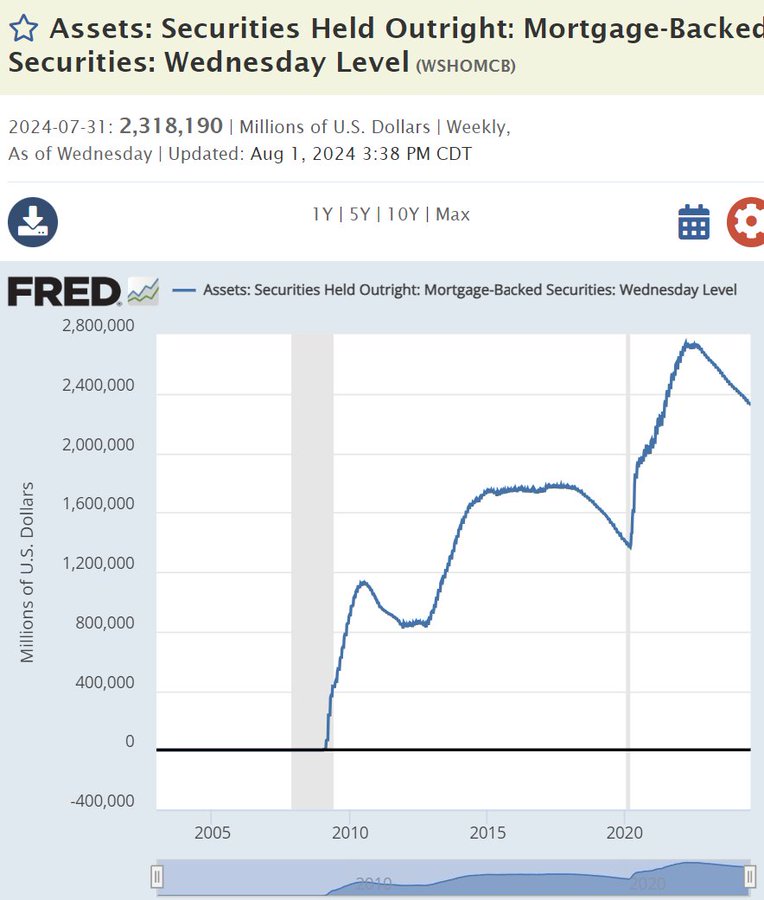
The Fed also has to contend with a grossly overstated housing market that has yet to see a meaningful re-rate. Instead, they bought Mortgage-Backed Securities accelerating the run up in home prices. All of these home prices ran to record levels all the while real wages have fallen.
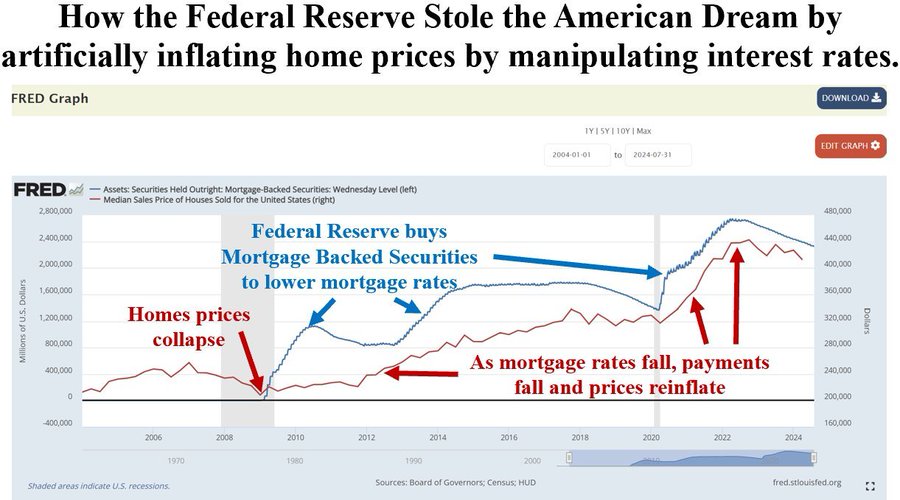
The below chart puts into perspective the amount of MBS that have been purchased since the Great Financial Crisis. You can see the absolutely absurd levels of purchasing that has created this inflated nonsense.
When we look at the wages side of the equation, there was a shift lower across all levels of the U.S. economy- with the exception of union backed service providers.

When we put these two numbers together- here’s a look at home price gains vs wage increases.

The “wealth gap” only shifts further when we look at housing and real bank deposits. When we look at consumer finances (beyond CC debt and delinquencies), we can see the pressure by using real bank deposits based on income distribution.

The group that continues to make out well are the boomers given their position in the housing market and appreciation of asset prices.

When we look at the food price side, it only looks much worse: Even if food prices stopped going up, they are still about 70% higher than they were in 2020. Has your salary gone up by 70% since then?

On a global basis, we are seeing more evidence of stagflation creeping into the market. We’ve been very adamant about the pick-up of inflation as the global economy slows down heading into the fall. Patrick Zweifel put together the below chart, and I think correctly points out the following: “Global manufacturing PMI fell further in July by 0.9pt to 48.9 The detailed components send a signal of stagflation over the month as activity fell by 1.1pts to 48.6 while short-term inflationary pressures rose by 1.5pts to 54”

Activity components are at their lowest since the beginning of the year. While all regions contributed to the decline, divergences remain high in terms of levels: EM Asia ex-China remains by far the strongest region at 55.8, while DM are still the weakest at 46.6.

By country, activity components show:
- 44% of countries stay in expansion (>50) of which 21% are accelerating vs 3 months ago.
- India remains with the highest activity index and Norway & Vietnam are accelerating the most
- 24% are decelerating
- 47% deteriorating, Sweden the most
We described last month that the June numbers were not a trend change, but a positive shift driven by seasonal factors. As we’ve progressed through the summer, I think it’s becoming more apparent about the weakness in the market.

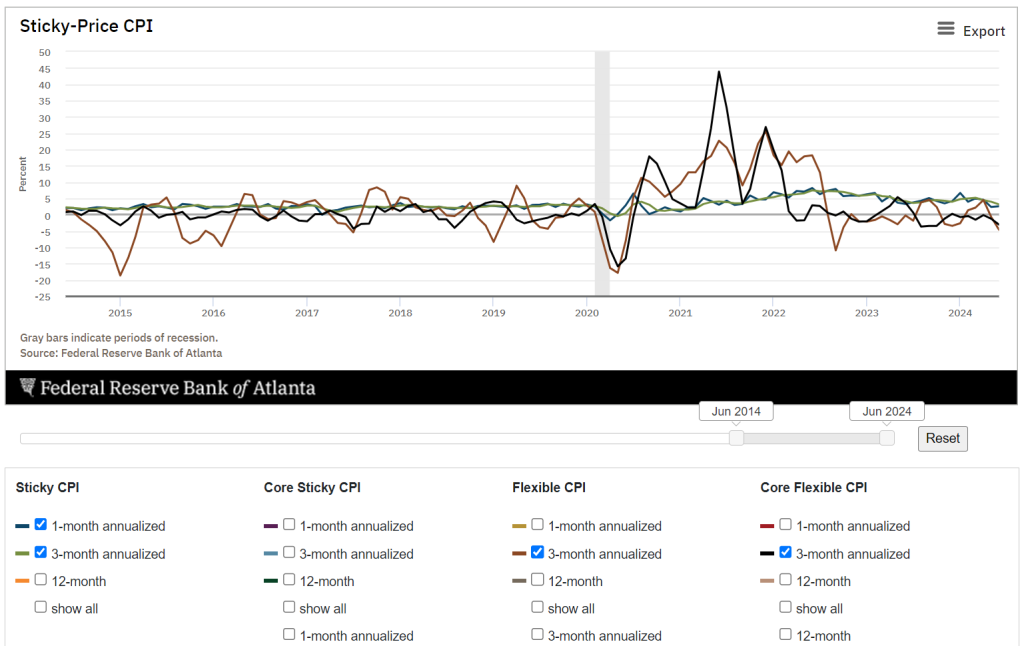
I think it’s important to appreciate the shift higher in inflation and the “sticky” nature of it.

We’ve discussed at length that the housing and service factors are causing inflation to remain sticky across the board. There is now additional increases in multiple facets of the U.S. markets that will pull inflation higher in July and August.
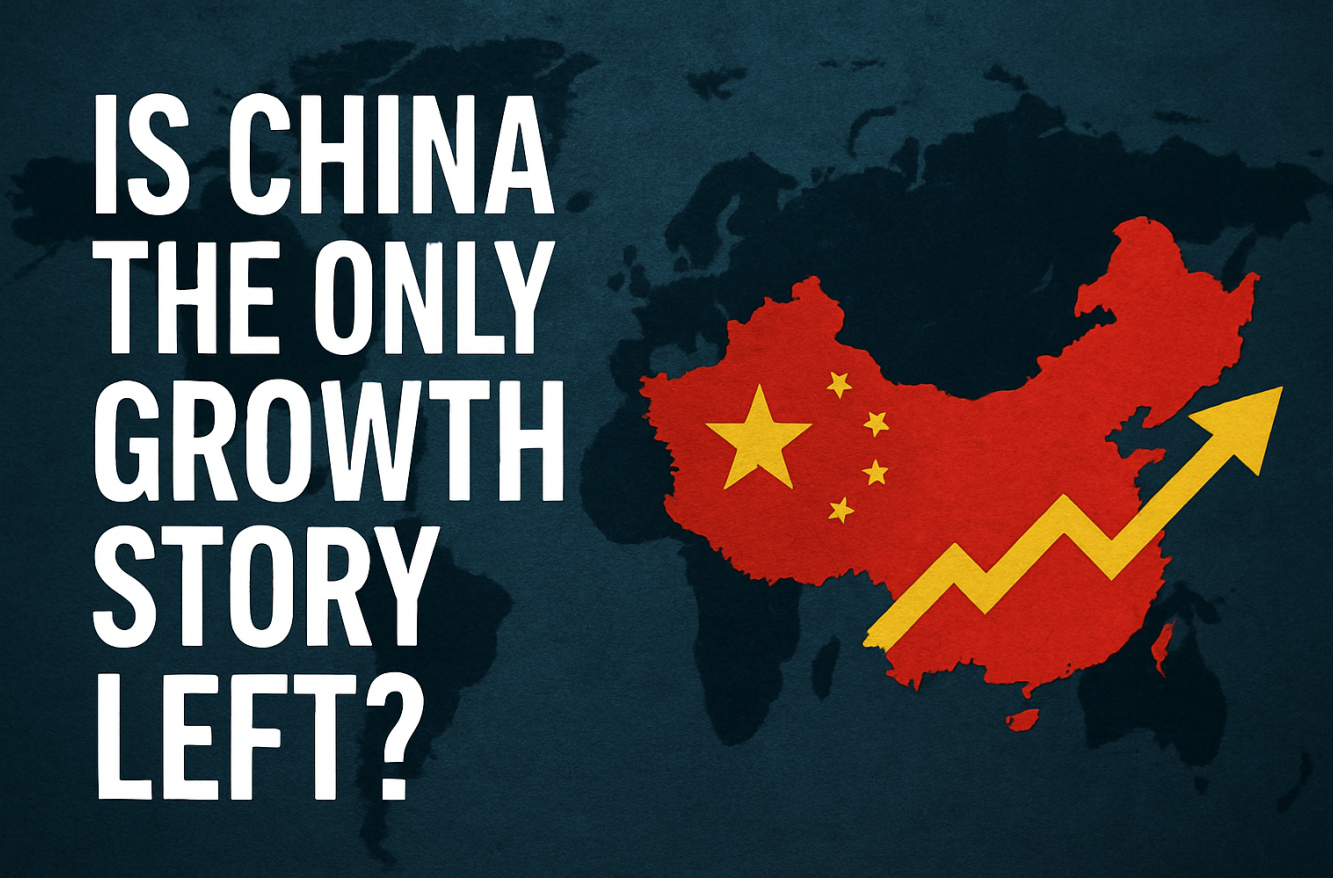
When we pivot to China, the data remains mixed and supports muted growth well into Q3. Caixin July. Services PMI 52.1 [Est.51.5 Prev.51.2] Caixin July. Composite PMI 51.2 [Prev. 52.8] *The services sector beat expectations but could not offset the negative impact from the manufacturing sector, the composite PMI was the weakest in 9 months.

China July Caixin Manufacturing PMI 49.8 [Est.51.5 Prev.51.8] *The lowest since March 2023.

We’ve been discussing the issues facing China for some time, and the focus on exports, manufacturing, and infrastructure is a mistake. These are areas that are already structurally oversupplied and additional stimulus won’t actually do much to support economic growth. Here is a quick summer of the PMI:
Caixin #China #Manufacturing PMI breakdown:
- The latest data signaled that conditions in the manufacturing sector deteriorated for the first time in nine months, albeit only marginally.
- Manufacturing output expansion was the slowest in the nine-month sequence during July.
- Purchasing activity declined for the first time since October 2023 as Chinese manufacturers reduced their buying activity in a period of falling new orders. This led to a renewed depletion of stocks of purchases.
- Input cost inflation eased, which alongside heightened competition led to Chinese manufacturers lowering average selling prices in July.
- Sentiment in the Chinese manufacturing sector remained positive in July, with the level of confidence rising from June’s low. Despite the reduction in new work, firms were positive that business development efforts and the launch of new products can help to drive sales in the year ahead.
Even as the data slows, it still doesn’t signal a need for stimulus, and I think the PBoC has been clear that additional stimulus will be ineffective. The top economies in the world are experiencing the effects of the Law of Diminishing Returns.
I think this Trivium quote really helps drive home what’s happening in the Chinese market.
On Saturday, the State Council released new guidelines on promoting services consumption.
ICYDK: In H1, services sector sales grew faster than consumer goods, but they are still significantly below pre-pandemic levels.
The guidelines focus on:
- Restaurants – encouraging internationally renowned catering companies to open “first stores” and “flagship stores” in China
- Eldercare and childcare – developing the “sliver economy” and lowering the cost of building and renovating nursing homes and childcare facilities
- Tourism – potentially expanding the list of visa-free countries
- Digital services – boosting support for industries including e-sports and livestream e-commerce, and promoting “smart home” services
- Healthcare – developing more commercial insurance products
The guidelines don’t offer anything concrete on what kind of fiscal support the government will mobilize to achieve these goals.
- The guidelines call on “local governments with capacity” to help fund the digital transition of “life services” companies – i.e., those involved in providing everyday services to individuals.
- They also encourage financial institutions to expand consumer loan issuance.
Get smart: This policy is weak sauce.
- Its goals are vague, and it doesn’t lay out any substantial fiscal support for achieving them.
Our take: To really boost services, authorities need to address the three key issues undermining consumer confidence – the declining property sector, stagnant income growth, and high youth unemployment.
- This plan whiffs on all three.
The market and investors keep waiting for the “magic” stimulus pill or renewed QE, but the Law of Diminishing Returns is a painful reminder that it all ends in tears.
- https://www.reuters.com/business/energy/opec-likely-stick-output-policy-meeting-sources-say-2024-08-01/
- https://twitter.com/OilCfd/status/1819438833211150642
- https://theoilbandit.substack.com/p/algos-gone-wild?r=1xngxs&utm_campaign=post&utm_medium=web&triedRedirect=true
- https://www.theguardian.com/world/article/2024/aug/06/oilfield-slowdown-exposes-political-volatility-in-libya-and-beyond
- https://x.com/TaviCosta/status/1821382713003409903


