
There was a recent piece that spoke about Big Oil’s managed decline that made me wonder whether such a development is actually happening. With so much going around it is crucial to separate “noise” from “signal”. When discussing whether shale is in “managed decline,” it’s crucial to look beyond surface-level metrics and understand what the underlying data actually tells us. That’s where Primary Vision’s two key indicators—Frac Spread Count (FSC) and Frac Job Count (FJC)—come into play. The FSC is a leading indicator of completion activity—it tracks how many frac spreads (composed of pressure pumping equipment, crews, etc.) are deployed at a given time.—essentially, it tells us what’s available on the supply side. Meanwhile, the FJC captures the number of actual completion jobs being performed each week, which gives us a clearer read on demand-side intensity. In other words, FSC shows how much equipment is in motion, and FJC tells us what it’s being used for.
What we’re seeing now—especially in the case of Exxon/XTO—is not a pullback in capability but an increasingly efficient deployment of that capability. Fewer spreads are accomplishing more jobs. That’s not decline. That’s evolution.
The logic behind the thought that shale is declining narrative has three major cracks. First, it interprets consolidation as a retreat. Exxon didn’t spend $60 billion to slowly fade out of the Permian. Take ConocoPhillips, for example. In November 2024, they completed a $22.5 billion acquisition of Marathon Oil, significantly expanding their asset base. This follows their 2021 purchase of Shell’s Permian assets for $9.5 billion. These aren’t the actions of a company in retreat; they’re calculated investments to bolster production capabilities and enhance operational efficiency. Similarly, Occidental Petroleum has been proactive. They expanded their partnership with Ecopetrol in 2024, committing $880 million to drill 91 new wells in the Permian and Delaware Basins by 2025. This initiative aims to build upon a 62% production increase achieved in 2024 from existing joint ventures. Such investments underscore a commitment to growth and optimization. A Dallas Federal Reserve survey revealed that 58% of shale executives plan to increase spending in 2025, with 34% intending to boost investment. This indicates a collective move towards expansion and confidence in the sector’s future.
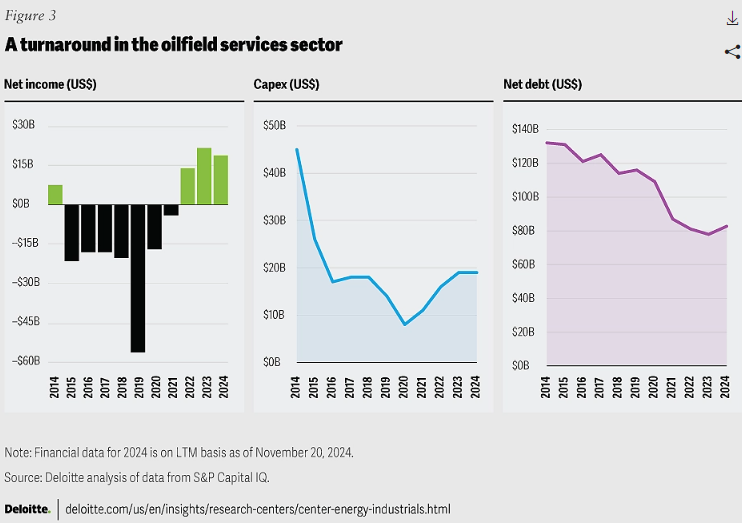
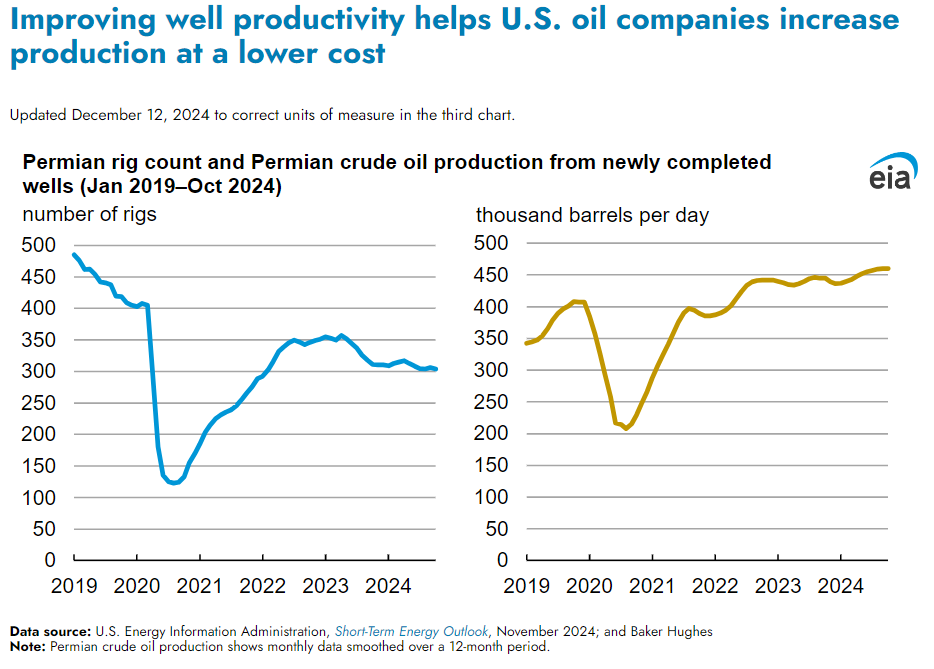
Second, lower capex growth is being conflated with lower ambition. That’s a false signal. We’re seeing more output from fewer rigs, fewer spreads, and smarter well placement. Capital discipline, in this case, is not passivity but precision. U.S. has managed to produce 60% more oil using 40% less workforce. Lastly, many analyses overlooks the extent to which technological evolution—longer laterals, pad drilling, automated well placement—has changed the game. U.S. shale isn’t declining; it’s evolving. For instance, companies that utilize automated drilling have cherished a 20% boost in efficiency also resulting in higher returns for shareholders. Other technologies and methods such as Extended Reach Drilling (ERD), Managed Pressure Drilling and Real time data analytics have all helped in achieving more by investing less. Devon Energy has witnessed a 15% improvement in drilling efficiency via machine learning models while BP has been able to evaluate seismic data in just 8 – 12 weeks with the help of AI as compared to 6 – 12 months previously.
What does Primary Vision’s data say about this?
For further evidence, let’s look at one of the companies, ExxonMobil. Using Primary Vision’s E Fracs data, we can see what each operator is planning in terms of its Frac Spread Count and Frac Job Count. The following chart shows that ExxonMobil (via XTO Energy) is not only maintaining its frac activity but is actually on a growth trajectory through 2024 and into 2025. The Frac Spread Count (FSC) forecast indicates a clear upward trend from a base of around 5–7 active spreads earlier in 2024, climbing toward 10–12 by early 2025, with the shaded region showing even higher upside potential. This reflects increasing field-level operations—more spreads, more horsepower, more completion crews in the field.
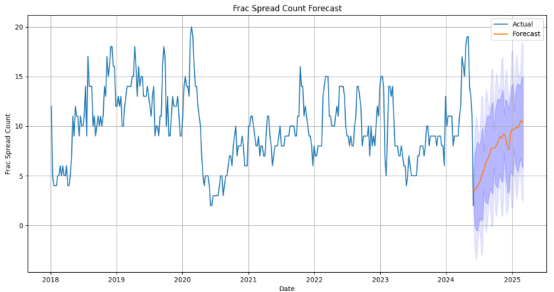
Source: Primary Vision E-Fracs
The Frac Job Count (FJC) forecast reinforces this story. Job counts, which are more granular indicators of daily completion activity, are also projected to rise. From a 2024 base around 5–6 weekly jobs, the forecast points to a jump toward 10+ jobs per week, again with an upper bound approaching 15–18. This means that the potential and plan for further production and activity is not only present but also being actively pursued.
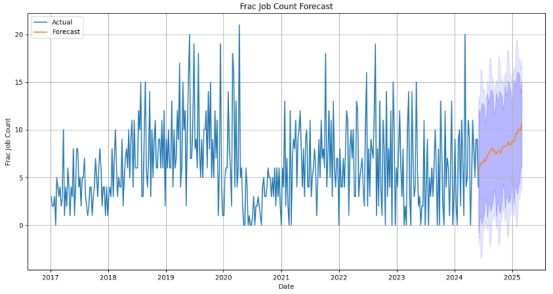
Source: Primary Vision E-Fracs
So when we hear claims of shale’s decline it’s worth asking—decline of what, exactly? Because the numbers don’t support it. Whether we look at ExxonMobil, ConocoPhillips, or Occidental, or drill deeper into the granular indicators like Primary Vision’s FSC and FJC, what we’re seeing is not a retreat but a recalibration. Activity may not be booming like in 2018 (and this is an important point) but it’s far from winding down. It’s more disciplined, more surgical, and more strategic. The shale sector has evolved from a growth-at-all-costs model to one that prizes returns and repeatability—and that’s not decline, it’s maturity. The rigs are still turning, the spreads are still running, and the job counts are still climbing.
I’d like to leave the reader with an interesting thought experiment: now with oil prices falling into lower 60s – with the possibility of going even further down – what do you think will be the response of U.S. to such developments? High tariffs, increased supply and stagnant demand growth might present yet another challenge for shale. Time will tell whether efficiency gains and fiscal discipline can carry the weight of this next challenge.


