- Mammoth Energy expects to field two more frac fleets by Q1 2023.
- By the end of 2023, its fleet count can rise to seven
- However, the onset of an economic recession in Q2 can derail its outlook
- A steep increase in the FY2022 capex budget can test the already deteriorated cash flows
The Recessionary Challenge and Infrastructure Prospects
Mammoth Energy Services’ (TUSK) Infrastructure segment accounted for 28% of its Q2 2022 revenues, down sharply from 36% a quarter ago. However, revenues from this segment did not drop in Q2. Instead, it increased mildly following higher storm restoration activities. As discussed in our previous article, it renewed its infrastructure focus in 1H 2022. Following the positive momentum, it plans to add additional crews for the seasonal storm restoration services in Q3 and Q4. In mid-2022, the US government signed a $1.2 trillion bipartisan Infrastructure Investment and Jobs Act and the $2.3 trillion Build Back Better Act. Federal spending will likely stimulate various infrastructure projects.
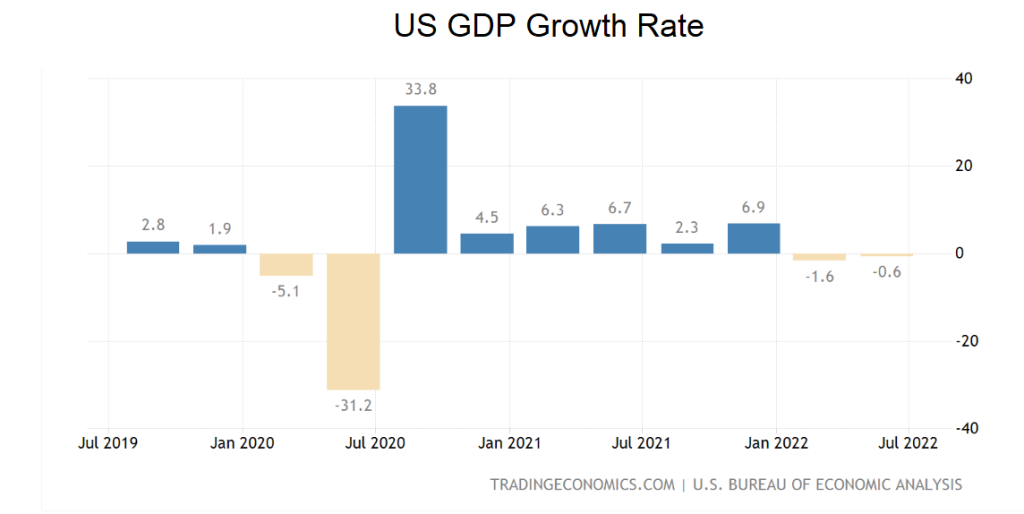
The economy shrank by 0.6% in Q2 2022, following a 1.6% drop in Q1. Therefore, it entered a recession in Q2. While spending on food and beverages declined, food services and accommodations increased. Investment also fell for structures and equipment. These are the current headwinds that TUSK will face in the near-to-medium term. However, the company has a diversified portfolio, including oilfield services and business. In 2022, the management strengthened its fiber maintenance, installation contracts, and MSAs (master service agreements). It will leverage its differentiated service offerings to fuel earnings growth.
Oilfield Services: Industry And Outlook
Since Q2, the crude oil price has declined by 12% until now. Demand has wobbled as the Russia-Ukraine war rages on, while the supply side has remained tight following OPEC’s reservation to increasing output. From January 2022 to July 2022, the drilled and completed well count was higher (28% and 7% up, respectively), while the drilled but uncompleted (or DUC) wells declined by 9%.
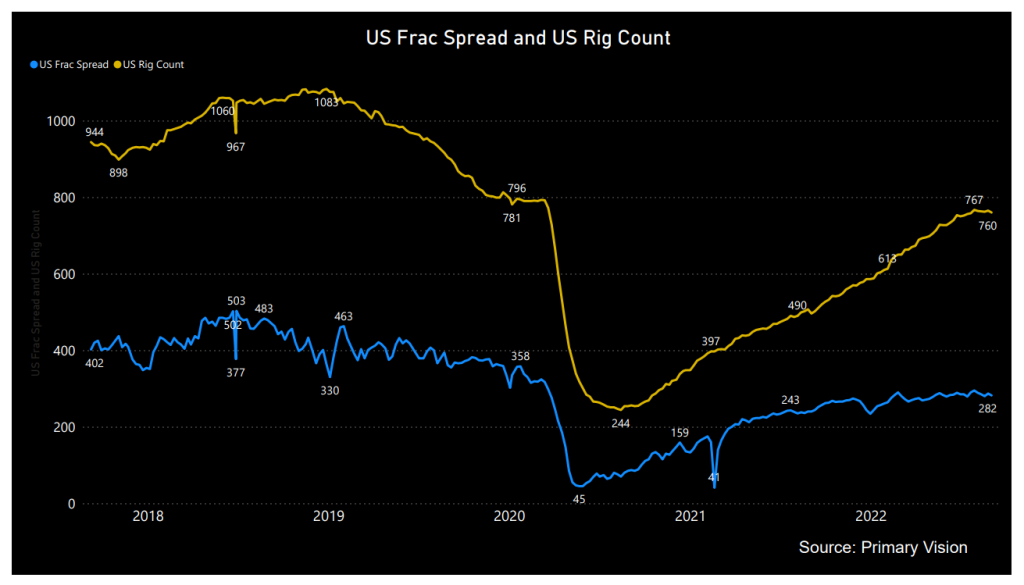
Year-to-date, the active frac spread count went up by 23%, according to Primary Vision’s estimates. The robust macro demand has re-energized the pressure-pumping industry. The Well Completion segment’s share has increased to 48% in Q2 from 38% in Q1. Mammoth Energy operated four hydraulic fracturing fleets in Q2, up from three in Q1. It expects to activate the fifth fleet in Q3 and the sixth fleet in Q1 2023. It also plans to add a new Tier 4 dual fuel system in 2023. By the end of 2023, its fleet count can rise to seven. In the sand business, too, pricing improved in Q1. If implemented, the entire operating fleet can generate $63 million-$84 million in net income per year and $105 million-$126 million in EBITDA per year. The steady growth in the count is an encouraging sign to keep the topline busy in the coming quarters.
TUSK can increase sand production from 120,000 tons per month to 150,000 tons per month. The company has also established a vertical integration model, enabling it to switch from T&D (transmission & distribution) equipment to refurbishing frac equipment. The integrated model, including trucking, last-mile logistics, and sand production, has allowed it to accelerate the process by five to ten weeks. Sand pricing has also improved, as we discussed above. However, the challenge lies in low rail turnover in Q2. So, it plans to add tonnage to its plants in Q3 and Q4.
PREPA Update
Please read my previous article to learn about TUSK’s engagement and repayment trouble in the energy restoration project in Puerto Rico through PREPA (Puerto Rico Electric Power Authority). In June, TUSK announced the first appeal response from FEMA. Earlier, an appeal by FEMA denied $47 million of the claimed costs under the first contract. FEMA has found that staffing costs of $24.4 million are eligible for funding. The total amount PREPA owes Cobra (Mammoth’s subsidiary) exceeds $350 million. It remains a matter of debate whether TUSK will be able to receive its entire receivable from PREPA.
Recent Drivers: Q2 2022

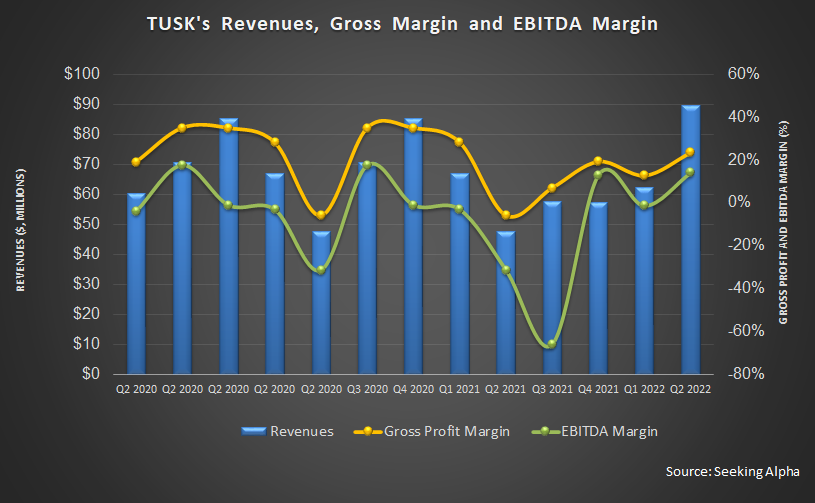
As the industry indicators strengthened, TUSK’s frac fleet more than doubled to 3.6 in Q2 from a quarter earlier. During this period, the company’s average sand price and volume increased by 25% and 6.5%, respectively. As a result, its topline increased by 44% sequentially, due primarily to the robust well-completion services segment growth. Plus, increased demand and higher pricing in the sand and infrastructure businesses led to the revenue rise.
In Q2, the company recorded a net income of $1.7 million compared to a net loss of $14.8 million in Q1. Its Q2 adjusted EBITDA was $23 million, a sequential increase of 147%. The adjusted EBITDA growth resulted from substantial gains in infrastructure, well-completion services, and the sand business.
Low Leverage, Negative FCF, Capex To Rise
As of June 30, 2022, TUSK’s liquidity (excluding working capital but revolving credit facility available) was $29 million. Its cash flow from operations (or CFO) turned negative in 1H 2022 versus a positive CFO a year ago. Despite higher year-over-year revenues, adverse timing of cash inflows for accounts receivable led to the cash flow drop.
As a result, free cash flow was negative in 1H 2022. The company’s leverage (debt-to-equity) is low (0.19x). The management has increased the FY2022 capex budget by 66% from its previous estimate. Despite negative cash flows in 1H 2022, the management expects to fund its FY2022 capex with cash flow from operations and available liquidity.
Learn about TUSK’s revenue and EBITDA estimates, relative valuation, and target price in Part 2 of the article.


