Primary Vision
  • HOME
  • ABOUT US
    • ABOUT US
    • PRIMARY VISION AI INNOVATIONS
  • RESEARCH
    • INSIGHTS & ARTICLES
    • FREE ARTICLES
  • EVENTS
  • PRESS
  • SUPPORT
  • FAQ
  • LATEST NEWS
  • LOGIN
  • SIGN UP!
    • FRAC SPREAD COUNT SIGN-UP!
    • ENTERPRISE SUBSCRIPTION PLAN SIGN UP!
  • HOME
  • ABOUT US
    • ABOUT US
    • PRIMARY VISION AI INNOVATIONS
  • RESEARCH
    • INSIGHTS & ARTICLES
    • FREE ARTICLES
  • EVENTS
  • PRESS
  • SUPPORT
  • FAQ
  • LATEST NEWS
  • LOGIN
  • SIGN UP!
    • FRAC SPREAD COUNT SIGN-UP!
    • ENTERPRISE SUBSCRIPTION PLAN SIGN UP!
No Result
View All Result
Primary Vision
Home Market Trends

NexTier Oilfield Solutions Part 2: Estimates And Relative Valuation

Avik Chowdhury by Avik Chowdhury
February 24, 2023
in Market Trends
0

  • Our regression estimate suggests NEX’s revenues will go moderately higher in NTM 2023 and NTM 2024.
  • EBITDA can remain steady in NTM 2023, but the growth rate can accelerate in NTM 2024.
  • The stock is undervalued versus its peers at the current level.

Part 1 of this article discussed NexTier Oilfield Solutions’ (NEX) outlook, performance, and financial condition. In this part, we will discuss more.

Linear Regression Based Forecast

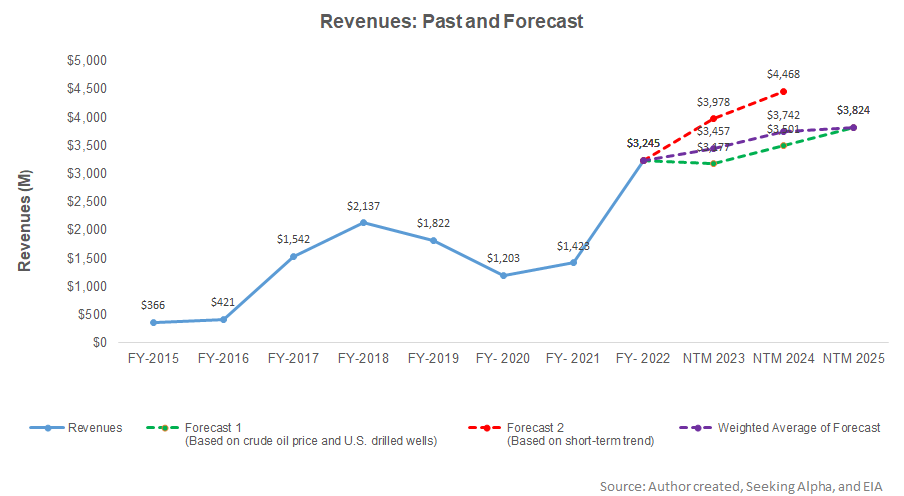
Based on a regression equation between the key industry indicators (crude oil price and drilled rigs) and NEX’s reported revenues for the past eight years, as well as its past four-quarters, we expect its revenues to increase by 7% over the next 12 months (or NTM 2023). The topline growth can remain steady at 8% in NTM 2024. For the short-term trend, we have also considered seasonality.

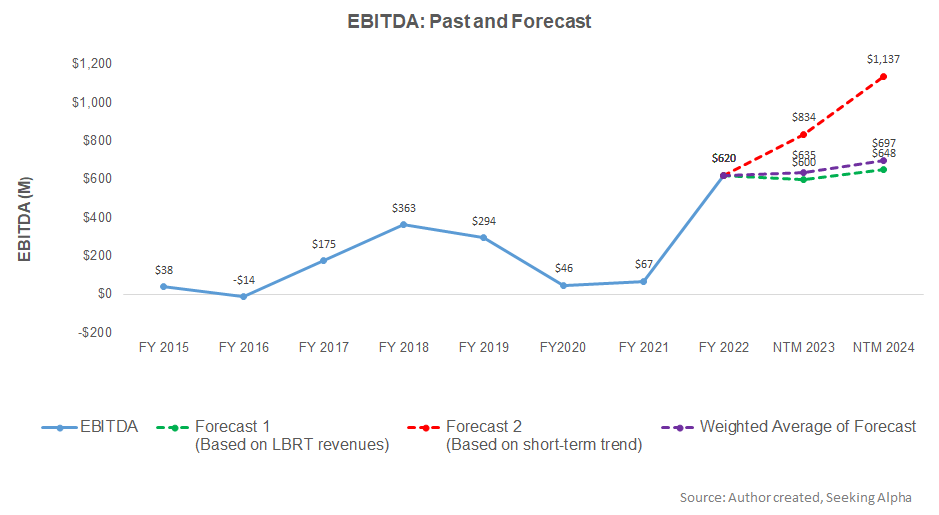
Based on the regression model using the average forecast revenues, we expect the company’s EBITDA to increase by 2% in NTM 2023 and 10% in NTM 2024.

Target Price And Relative Valuation

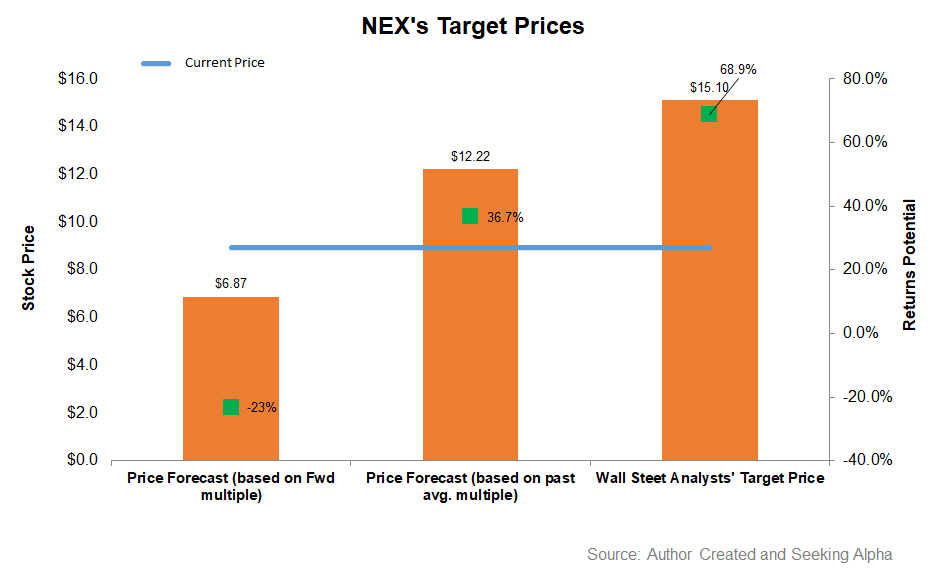
EV has been calculated using the forward and past five-year average multiple. Returns potential (23% downside) using the forward EV/EBITDA multiple (2.9x) is lower than Wall Street’s sell-side analyst expectations (69% upside) and the past average EV/EBITDA multiple (37% upside) from the stock.

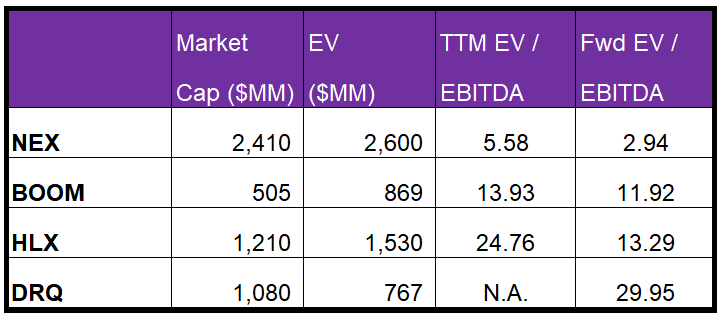
NEX’s forward EV-to-EBITDA multiple contraction versus the current EV/EBITDA is steeper than peers, which typically reflects a higher EV/EBITDA multiple than its peers. The stock’s EV/EBITDA multiple (5.6x) is much lower than its peers’ (BOOM, HLX, and DRQ) average. The current multiple is also lower than its five-year average (23.2x). So, relative valuation-wise, the stock is undervalued at the current level.

Analyst Rating And Target Price

According to data provided by Seeking Alpha, eight sell-side analysts rated NEX a “buy” in the past 90 days (including “Strong Buy”), while three of the analysts rated it a “hold.” None of the analysts rated it a “sell.” The consensus target price is $15.1, suggesting a 69% upside at the current price.

What’s The Take On NEX?

NEX will likely see many challenges, not least of which is the delivery delay of its electric frac fleets until Q2 2023 due to Capital discipline, supply chain issues, and inflation. Over the next year and a half, it plans to decommission ~150,000 horsepower. Natural gas prices continued to decline over the past few months has truncated its growth path severely. So the stock underperformed the VanEck Vectors Oil Services ETF (OIH) in the past year.

However, some of these issues result from the company’s strategy to allocate capital to the highest return investment while disinvesting older equipment. Return on invested capital has improved by 30% over the past year through capital reduction. In FY2023, the company expects to generate $500 million in free cash flow and plans to grow free cash flow to adjusted EBITDA ratio by 40% to 50%. The stock is undervalued relative to its peers at this level, which might prompt investors to hold the stock for an upside in the medium term.

To unlock the content you need a
Premium
or Enterprise
Account!

Previous Post

NexTier Oilfield Part 1: Free Cash Flow Generation Shines Through The Challenges

Next Post

Year-Over-Year Oil Data (USA)

Related Posts

How does the current Middle East Situation play out?
Frac

How does the current Middle East Situation play out?

June 19, 2025
Market Sentiment Tracker: What the Latest Data Says: U.S. Steadies, Europe Slows, China Rebounds (Sort of)
Market Trends

Market Sentiment Tracker: What the Latest Data Says: U.S. Steadies, Europe Slows, China Rebounds (Sort of)

June 18, 2025
Monday Macro View: Top 5 Reasons Crude Prices Are Ascending – and the recent Middle East tension is only one of them!
Market Trends

Monday Macro View: Top 5 Reasons Crude Prices Are Ascending – and the recent Middle East tension is only one of them!

June 16, 2025
Nabors Industries’ Perspective in Q1: KEY Takeaways
Market Trends

Nabors Industries’ Perspective in Q1: KEY Takeaways

June 16, 2025
ProPetro’s Perspective in Q1: KEY Takeaways
Market Trends

ProPetro’s Perspective in Q1: KEY Takeaways

June 13, 2025
Market Sentiment Tracker: What If This Is as Good as It Gets?
Market Trends

Market Sentiment Tracker: What If This Is as Good as It Gets?

June 11, 2025
Next Post
Year-Over-Year Oil Data (USA)

Year-Over-Year Oil Data (USA)

Please login to join discussion

Recent News

How does the current Middle East Situation play out?

How does the current Middle East Situation play out?

June 19, 2025
Market Sentiment Tracker: What the Latest Data Says: U.S. Steadies, Europe Slows, China Rebounds (Sort of)

Market Sentiment Tracker: What the Latest Data Says: U.S. Steadies, Europe Slows, China Rebounds (Sort of)

June 18, 2025
Monday Macro View: Top 5 Reasons Crude Prices Are Ascending – and the recent Middle East tension is only one of them!

Monday Macro View: Top 5 Reasons Crude Prices Are Ascending – and the recent Middle East tension is only one of them!

June 16, 2025
Nabors Industries’ Perspective in Q1: KEY Takeaways

Nabors Industries’ Perspective in Q1: KEY Takeaways

June 16, 2025
ProPetro’s Perspective in Q1: KEY Takeaways

ProPetro’s Perspective in Q1: KEY Takeaways

June 13, 2025
Primary Vision

Established in 2011, we are renowned for our expert frac data and analytics, providing a rich array of unique indicators and industry commentary.

CONTACT

+1-713-554-4977
info@primaryvision.co

SOCIAL NETWORKS

POLICIES

Privacy Policy
Terms of Use

PARTNERS

Amazon Web Services

TRUSTED SITES

Logo

Logo

RECENT NEWS

How does the current Middle East Situation play out?

How does the current Middle East Situation play out?

June 19, 2025
Market Sentiment Tracker: What the Latest Data Says: U.S. Steadies, Europe Slows, China Rebounds (Sort of)

Market Sentiment Tracker: What the Latest Data Says: U.S. Steadies, Europe Slows, China Rebounds (Sort of)

June 18, 2025
Monday Macro View: Top 5 Reasons Crude Prices Are Ascending – and the recent Middle East tension is only one of them!

Monday Macro View: Top 5 Reasons Crude Prices Are Ascending – and the recent Middle East tension is only one of them!

June 16, 2025
Nabors Industries’ Perspective in Q1: KEY Takeaways

Nabors Industries’ Perspective in Q1: KEY Takeaways

June 16, 2025
ProPetro’s Perspective in Q1: KEY Takeaways

ProPetro’s Perspective in Q1: KEY Takeaways

June 13, 2025
  • HOME
  • ABOUT US
  • RESEARCH
  • EVENTS
  • PRESS
  • SUPPORT
  • FAQ
  • LATEST NEWS
  • LOGIN
  • SIGN UP!

© 2025 Primary Vision. All rights reserved.

  • HOME
  • ABOUT US
    • ABOUT US
    • PRIMARY VISION AI INNOVATIONS
  • RESEARCH
    • INSIGHTS & ARTICLES
    • FREE ARTICLES
  • EVENTS
  • PRESS
  • SUPPORT
  • FAQ
  • LATEST NEWS
  • LOGIN
  • SIGN UP!
    • FRAC SPREAD COUNT SIGN-UP!
    • ENTERPRISE SUBSCRIPTION PLAN SIGN UP!

© 2025 Primary Vision. All rights reserved.