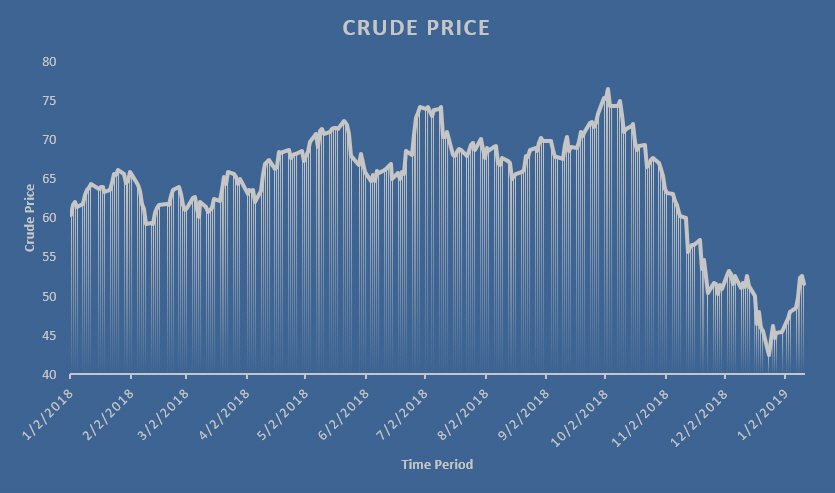
Crude prices have been declining the past few months as there’s a perception of an oversupplied market and added tension in trade talks with China. In October 2018, oil prices did bounce back as a result of OPECs announced 1.3 million bpd cut. Towards the end of the year crude prices witnessed levels below $50 a barrel (including touching a low of $42.53 on December 25) for the first time since October 2017 on signs of an oversupplied market.

Falling crude prices have had a direct impact on E&Ps. According to data from Baker Hughes, the rig count has increased from 480 in August 2018 to 488 in January 2019, however completions have since slowed. Operators seem to be hyper-focused on their drilling programs vs. their completion programs through Q4. This is typical as they aim to reposition their hedges and lock in better terms with pressure pumpers.
Analysts look at the length of laterals, frac sand quantities per well, and frac stages per well or even count the stimulation crews (aka frac spreads, frac fleets) to analyze production estimates.
Our metric, the Frac Spread Count, does the latter and we’ve uncovered a slow down in the Permian that recently has taken a turn for the worse.
The permian basin frac spread count has decreased from 192 (in June of 2018) to 140 (as of January 2019) representing a 27 % decline.
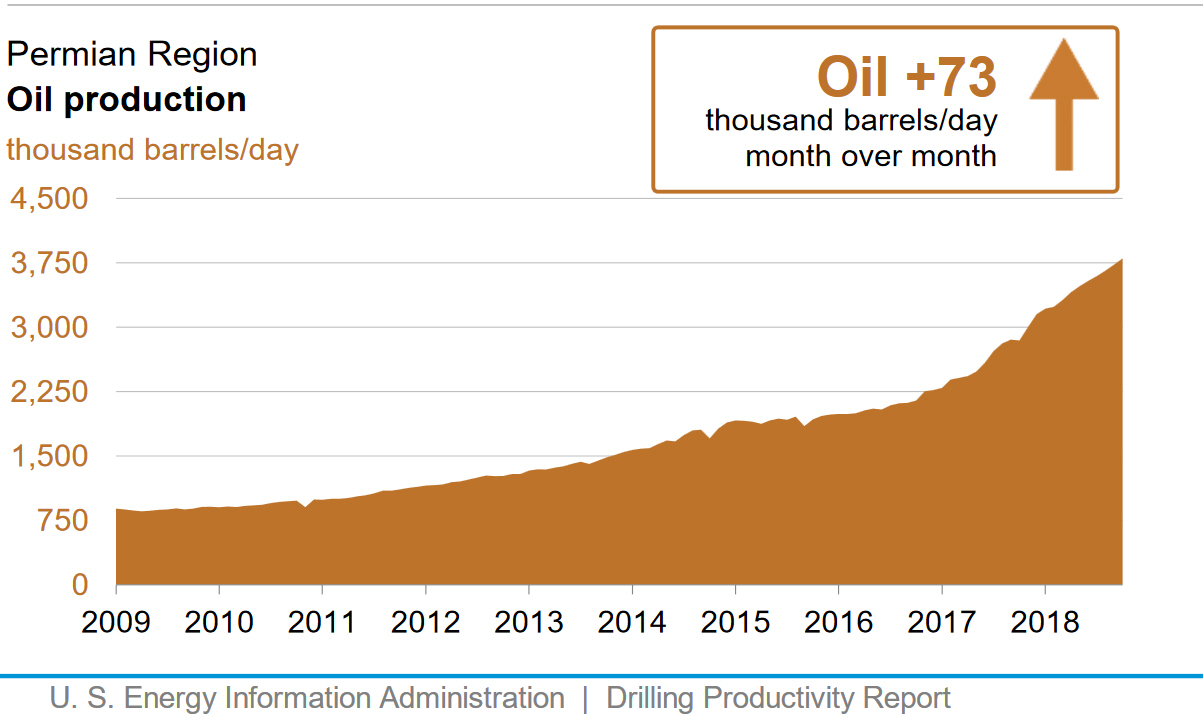
The overly optimistic number projected by companies during the period of 2014 to 2017 in the Permian basin seems to have not lived up to their expectations. The below chart represents the increase in oil production in the Permian Region from 2009 to 20182.

 According to Schlumberger CEO Paal Kibsgaard, the trend in the Permian basin is similar to the Eagle Ford shale play, which indicates that producers there have run out of new “good rock” and are trying to get every bit from the known sweet spots. In the Permian’s Midland Wolf Camp section, child wells are already approaching 50 percent of new wells drilled3.
This being said, many operators can hold on with crude prices hovering around $35 though they would be most comfortable in a $45-$50 range per our research. However, this will have an impact on new drilling, the DUC count (drilled yet uncompleted wells) and ultimately the frac spread count. With a 40% drop in crude prices since October 2018 pressure pumpers are being challenged to manage demand in a market where roughly 500 spreads are ready to work. We’ve seen frac spread utilization go from over 90% to under 80% in less than a year. Frac spread utilization will be challenged and from our research frac spread capacity is scheduled to increase throughout the year as pumpers tie their futures to newly opened pipelines.
OPEC and its allies have agreed to reduce output by 1.2 million barrels per day (bpd) from January, in a move to be reviewed at a meeting in April. However, in the near term, the key global trend to watch out would be Chinese oil demand and accurate supply cuts from OPEC and non-OPEC that may drive crude prices higher4.
Our forecast calls for a stabilization in the oil markets, followed by a rally in completions as we approach the spring. The issue here is the pain that oilfield service companies will feel in the short-term.
Will there be layoffs?
Is ofs consolidation looming?
Will we see more electric fleets be ordered that seem to have long term financial benefits?
Will we see operators continue to switch pressure pumpers in an effort to cut costs?
Are the oil markets really going to hold and/or rally?
These are the stories we’ll be following.
Follow us on twitter @primaryvision
Learn more about Primary Vision here: pvmic.com or fracspreadcount.com
_____________________________
1https://www.macrotrends.net/2516/wti-crude-oil-prices-10-year-daily-chart
2https://www.eia.gov/petroleum/drilling/pdf/permian.pdf
3https://www.desmogblog.com/2018/10/30/peak-shale-us-fracking-industry-permian-decline
4https://www.reuters.com/article/us-usa-rigs-baker-hughes/u-s-drillers-add-oil-rigs-permian-count-near-four-year-high-baker-hughes-idUSKCN1MM2AF


