Primary Vision Network
  • HOME
  • RESEARCH
    • ARTICLES
  • VIDEOS
  • PRESS
  • SUPPORT
  • SHOP
  • ABOUT US
  • SIGN UP!
  • LOGIN
No Result
View All Result
  • HOME
  • RESEARCH
    • ARTICLES
  • VIDEOS
  • PRESS
  • SUPPORT
  • SHOP
  • ABOUT US
  • SIGN UP!
  • LOGIN
No Result
View All Result
Primary Vision Network
No Result
View All Result
Home Frac

The Big Red Mothership: Halliburton 2016 Q2 Comments and more

Matthew Johnson by Matthew Johnson
July 20, 2016
in Frac
0

by Matt Johnson

Halliburton (HAL: $44.28) reported its 2016 second quarter results yesterday and things seem to be ok, all things considered.  The majority of this article will focus on their pressure pumping activities in the United States.

The Good:  Halliburton is #1 in multiple categories of U.S. Hydraulic Fracturing.  Their stock has increased over 30% in 2016 and has outperformed their peers.

Being #1 isn’t easy.

WATER VOLUME – HAL is #1 in total water volume (total water used) in 2013, 2014, 2015 and look to stay on top at current activity levels in 2016.
PROPPANT MASS – HAL pumped the most proppant of any service provider in the U.S. over the same three year period.  2016 looks much the same.
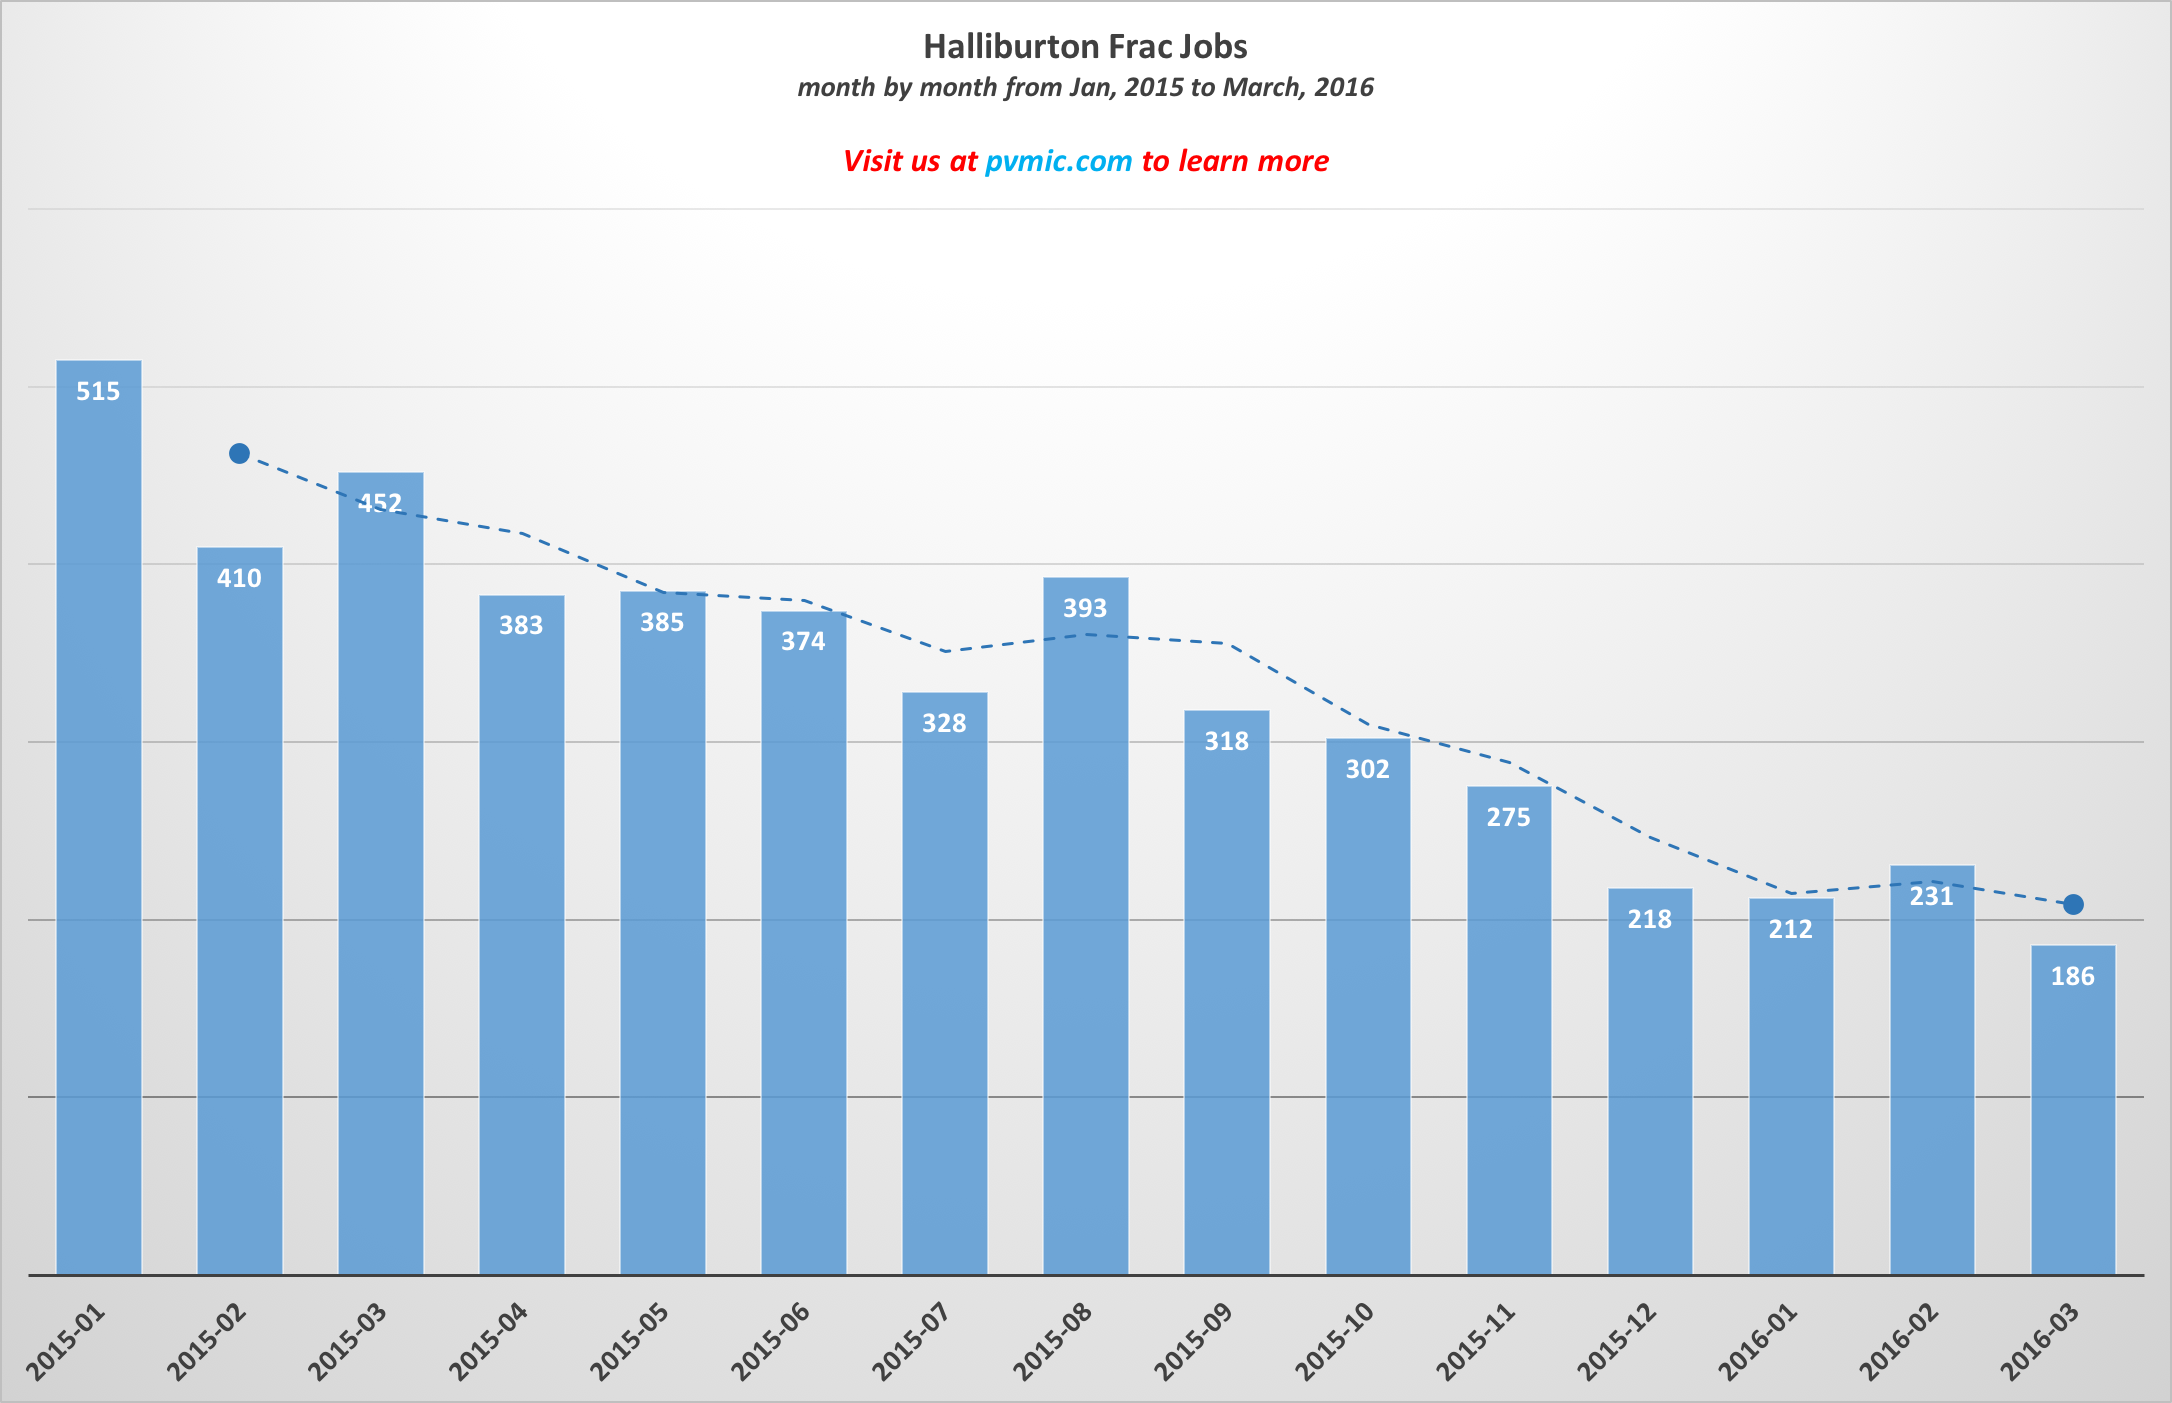
TOTAL NUMBER OF FRAC JOBS – In 2015 they fractured the most wells, close to 4,400 in the U.S., almost 3-1 over #2 Baker Hughes who had over 1,600.

The Bad: Revenue decreased 43% year over year (Q2 2015 to Q2 2016).  They posted a loss of $3.2b this past quarter (2016 Q2).

t h e   u g l y: Due to the failed merger that was realized on May 1st, HAL had to pay a $3.5b break up fee to Baker Hughes (BHI: $45.71). Venezuela did not pay $148mm in invoices (however HAL did secure a $200mm promissory, terms were not disclosed in the filing) among other impairment charges that approached $425mm. HAL commented that they’ve laid off 1/3rd of their workforce since late 2014.

Those are some 2016 second quarter highlights, or lowlights, depending on how you look at it.  We took a deeper look into our database of frac jobs (~120k jobs in the U.S. over the last 6 years) to Show hal’s activity by Frac job and frac spread.

Note: The Q2 2016 data is incomplete as there is a lag in the data of ~100 days.
Note: There is a lag in the data of about ~100 days. We continue to capture new data every single day (Running Frac Spreads = blue) and compliment the data lag with our custom forecasting algorithm (Forecast = orange). If you click on the chart you will better be able to see the chart labels.

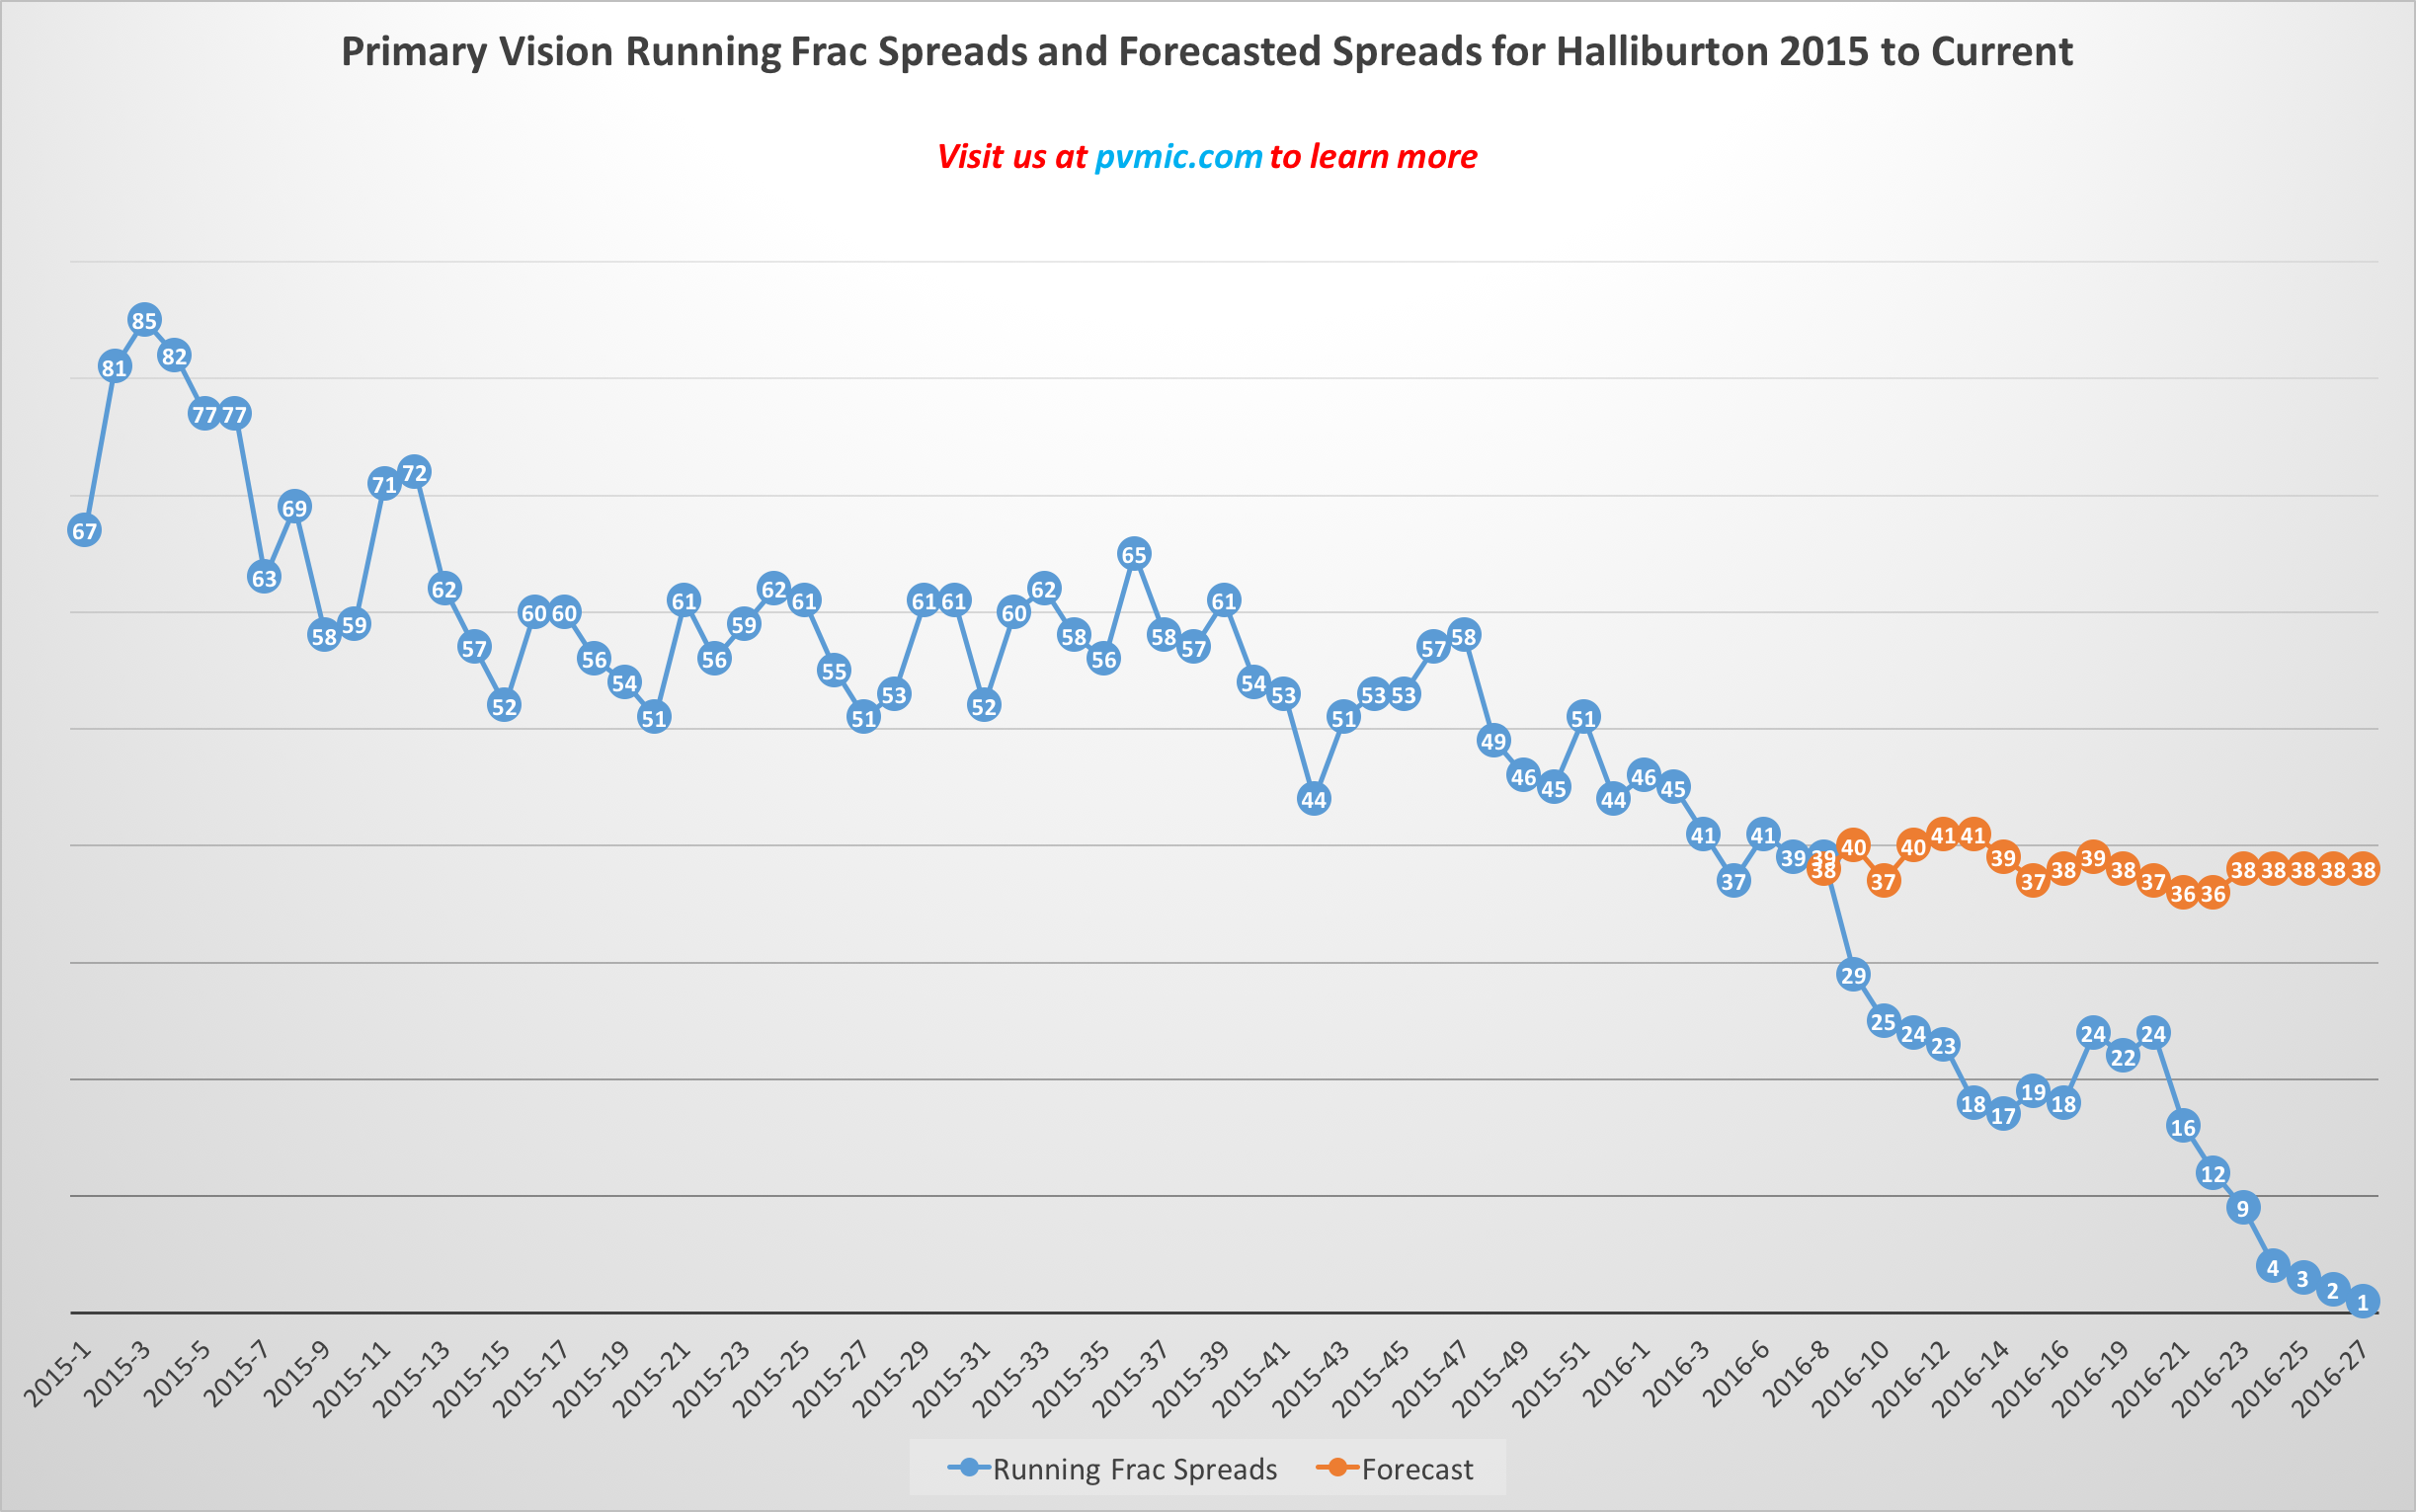
Interested in learning more about the Primary Vision Frac Spread Count or what a frac spread is? More information here.

HAL REFRACS
We tracked, presented and reported on refracs in the U.S. last year at multiple conferences and quickly determined that HAL was on the forefront of refrac technology.  While producers and pumpers are still learning and realizing the benefits of refracs, HAL made significant strides in technology, technique and candidate well selection in 2015.  We think refracs are in their infancy and will provide a substantial source of revenue for producers and pumpers in the years to come.  HAL committed themselves to a long-term approach to refracs and as a result will stand tall as producers add refrac programs to their future plans.

As rig and spread counts, as well as crude prices, continue to level the market seems to be headed in a positive direction.  HAL has positioned themselves to be the lean and mean red machine that they can and should be.  They commented that even a modest uptick in the second half of 2016 would reap benefits.  Let’s hope they’re right.

Schlumberger (SLB: $80.60) reports their results today, July 21st.  BHI on July 28th.

sources
Kaya Yurieff of The Street “Halliburton (HAL) Stock Higher After Q2 Results Top Estimates”
Reuters “Halliburton reports $148 mln loss from Venezuela operations”
David Wethe of Bloomberg “Halliburton Sheds More Jobs, Looks to North America Recovery”
Natural Gas Europe “Halliburton Reports $3.2B Loss in 2Q”
Primary Vision Frac Database
Primary Vision Frac Spread Count

Disclaimer
The data presented above has a margin of error of 5-8% as a result of E&P and/or service company errors or incorrect data filings.  Neither the information, nor any opinion contained in this site constitutes a solicitation or offer by Primary Vision or its affiliates to buy or sell any securities, futures, options or other financial instruments or provide any investment advice or service.

Tags: 2016analyticsBig DataChesapeake Energycommentsdatafracfrac proppant visionFrac Spread CountFrac SpreadsFrac visionfrac water indexfrac water visionfracturingHALHALLIBURTONhorizontal drillinghydraulichydraulic fracturingnatural gasnatural gas productionprimary vision frac spread countproppant mass indexQ2 resultsrefrac'edrefrac;ingrefrack'edrefrack'ingSandshalewaterwell performance
Previous Post

Frac Spread Count 2.0 – June 2016

Next Post

Big Blue: Schlumberger 2016 Q2 Comments and more

Related Posts

Primary Vision Insights
Frac

Primary Vision Insights

January 27, 2023
Primary Vision Insights
Frac

Primary Vision Insights

January 20, 2023
Primary Vision Insights
Frac

Primary Vision Insights

January 13, 2023
Primary Vision Insights
Frac

Primary Vision Insights

January 6, 2023
Primary Vision Insights
Frac

Primary Vision Insights

December 24, 2022
Primary Vision Insights
Frac

Primary Vision Insights

December 17, 2022
Next Post

Big Blue: Schlumberger 2016 Q2 Comments and more

Please login to join discussion

Recent News

RES Part 2: Estimates And Relative Valuation

RES Part 2: Estimates And Relative Valuation

January 30, 2023
RES Part 1: RES Mulls Fleet Composition Change As It Hikes Dividend

RES Part 1: RES Mulls Fleet Composition Change As It Hikes Dividend

January 30, 2023
Shifting Oil Flows, Changing Weather Patterns

Shifting Oil Flows, Changing Weather Patterns

January 29, 2023
Year-Over-Year Oil Data (USA)

Year-Over-Year Oil Data (USA)

January 27, 2023
Primary Vision Insights

Primary Vision Insights

January 27, 2023
Primary Vision Network

We are a data driven news organization, providing market intelligence covering the global oil and energy space.

CONTACT

+1-713-554-4977
info@primaryvision.co

SOCIAL NETWORKS

POLICIES

Privacy Policy
Terms of Use

PARTNERS

Amazon Web Services

TRUSTED SITES

Logo

Logo

LATEST TWEET

RECENT NEWS

RES Part 2: Estimates And Relative Valuation

RES Part 2: Estimates And Relative Valuation

January 30, 2023
RES Part 1: RES Mulls Fleet Composition Change As It Hikes Dividend

RES Part 1: RES Mulls Fleet Composition Change As It Hikes Dividend

January 30, 2023
Shifting Oil Flows, Changing Weather Patterns

Shifting Oil Flows, Changing Weather Patterns

January 29, 2023
Year-Over-Year Oil Data (USA)

Year-Over-Year Oil Data (USA)

January 27, 2023
Primary Vision Insights

Primary Vision Insights

January 27, 2023
  • HOME
  • RESEARCH
  • VIDEOS
  • PRESS
  • SUPPORT
  • SHOP
  • ABOUT US
  • SIGN UP!
  • LOGIN

© 2023 Primary Vision Network. All rights reserved.

  • HOME
  • RESEARCH
    • ARTICLES
  • VIDEOS
  • PRESS
  • SUPPORT
  • SHOP
  • ABOUT US
  • SIGN UP!
  • LOGIN

© 2023 Primary Vision Network. All rights reserved.

Loading...
0
    0
    Your Cart
    Your cart is emptyReturn to Shop
    Continue Shopping
    Products you might like
    • Eagle Ford Refracs
      $1,000.00 +Add

      Insert/edit link

      Enter the destination URL

      Or link to existing content

        No search term specified. Showing recent items. Search or use up and down arrow keys to select an item.